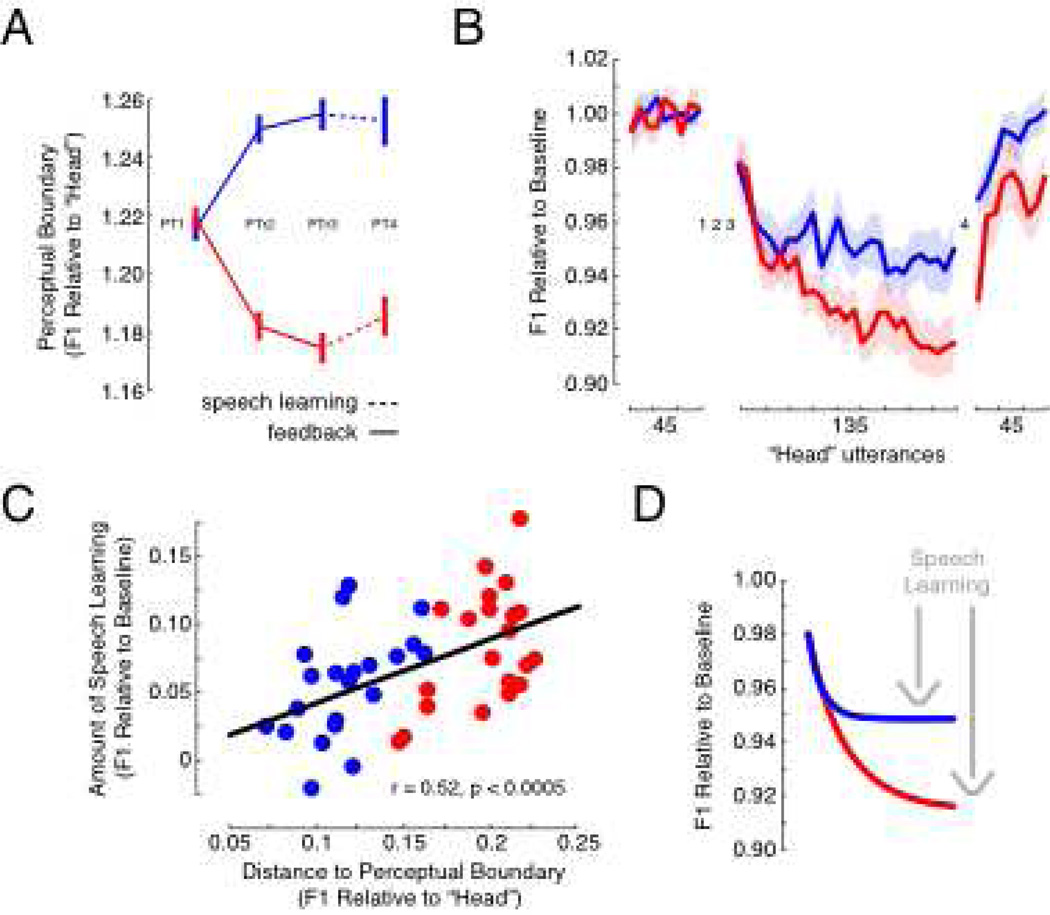
Figure 3.
Perceptual Training Altered Speech Motor Learning (A) During PTr2 and PTr3, feedback moved the perceptual boundary towards “had” (blue data) or “head” (red data) (p < 0.0005). Error bars represent +/− 1 SE. (B) Produced F1 frequency for “head” was normalized to baseline utterances. Subjects compensated for an increase in perceived F1 by decreasing produced F1 (trials 46 to 180). Subjects who had their perceptual boundary shifted towards “head” compensated more for altered auditory feedback than subjects who had their boundary shifted towards “had” (p < 0.04). They also showed greater compensation-related after-effects (p < 0.02). Error clouds represent +/− 1 SE, and the learning curves join averages computed from blocks of five utterances. (C) A significant correlation was observed between the distance from stimulus 10 (“Had”) to the trained perceptual boundary and the amount of compensation for altered auditory feedback. (D) Exponential functions were fit to compensation patterns for altered auditory feedback to visualize the effect of perceptual training on speech motor learning (grey arrows).

