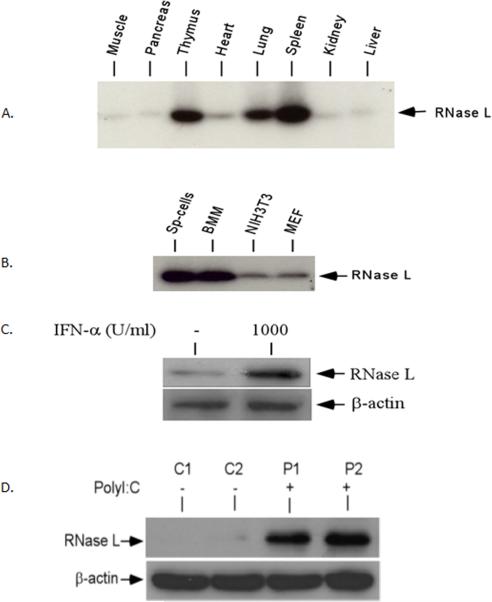
Fig.2.
Tissue distribution and expression of RNase L The expression of RNase L in the tissue extracts from eight organs (A) and several types of cells (B). Sp-cells: primary splenocytes; BMM: bone marrow-derived macrophages; NIH3T3: mouse fibroblasts; MEF: mouse embryonic fibroblasts. (C) IFN-α induces the expression of RNase L in NIT-1 cells NIT-1 cells were treated with 1,000 units/ml of IFN-α (R&D Systems) for 16 h and RNase L in the cells was determined by Western blot analysis. (D) Mice (2/group) were treated with or without poly I:C at a concentration of 5 μg/g body weight every other days for one week (three times) and the level of RNase L in the pancreatic tissue extract was determined by Western blot analysis with a polyclonal antibody to mouse RNase L.

