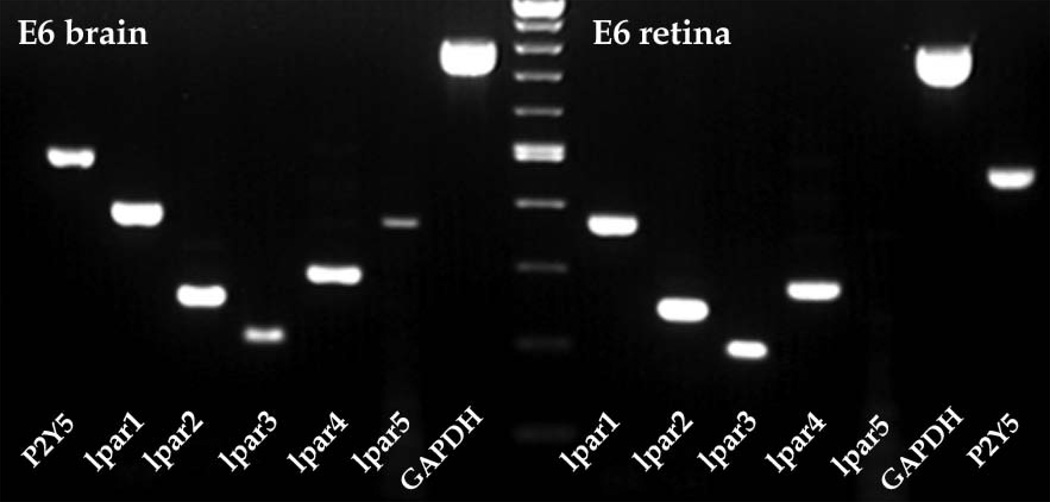
Figure 8.
Lpar gene expression in E6 chick retina by RT-PCR. RT-PCR expression of LPA receptor genes lpar1 to lpar5 as well as P2Y5 (lpar6) and GAPDH control from embryonic day 6 (E6) chick retina (right) compared to a brain control (left). Note the expression of all lpar genes except lpar5 in retina compared to expression of all genes in brain. Controls without reverse transcription (RT-) had no bands after PCR (data not shown). The center lane is a molecular weight marker.

