Figure 1.

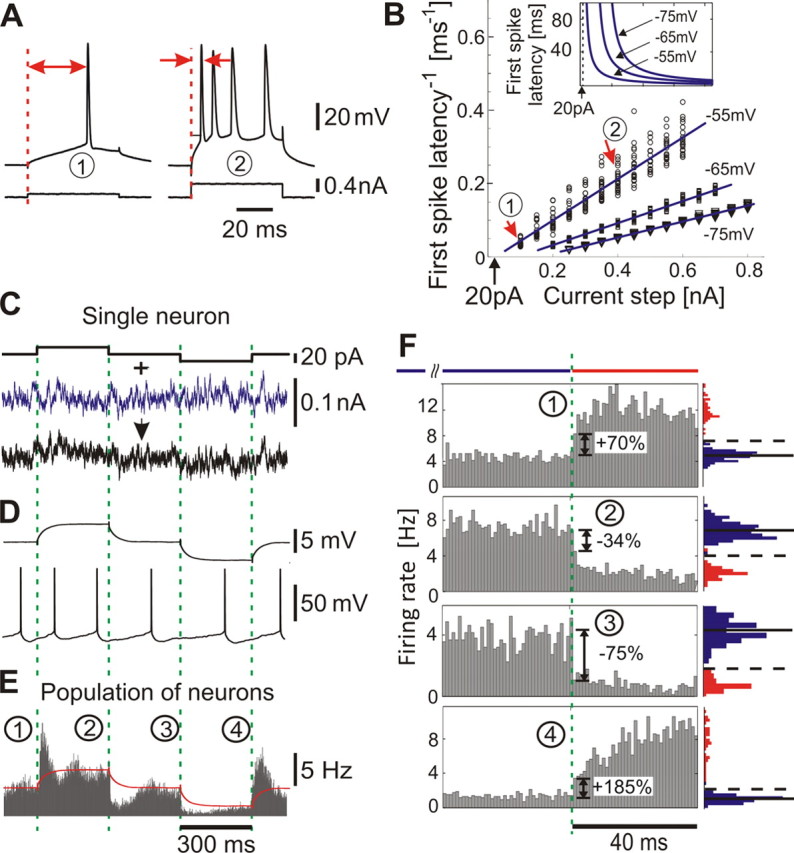
Encoding of current steps by single neurons and populations in vitro. A, Responses of a L2/3 neuron to 0.1 and 0.4 nA steps. Red arrows, First spike latency. B, Inverse first spike latency versus step amplitude (N = 20 for each step) and linear fits (blue lines). Red arrows, Responses in A. Inset, First spike latency versus step amplitude as derived from linear fits of the inverse first spike latency (same current scale). C, Current steps (top) and current steps immersed in fluctuating current (τI = 5 ms) (bottom). To ensure weak stimulation, we chose current steps of 20 pA, which in A correspond to an approximated latency >100 ms. D, Membrane potential response to subthreshold current steps as in C (top) (average, N = 20) and to current in C (bottom). E, Population firing in response to steps immersed in different realizations of fluctuating current, bin size 1 ms. Peristimulus time histogram is constructed over all repetitions pooled from all 15 cells (∼175 min; ∼52,000 spikes) by aligning the evoked spike trains with the onset of current steps. Red line, Membrane potential from D (top). F, Zoom-in on responses in E. Blue and red histograms denote distributions of spike counts in 1 ms bins 120 ms before (blue) and 40 ms after (red) each step. In the distributions before the step, solid horizontal lines denote the mean and dashed lines 3 SD. Dashed green lines in C–F indicate the onset of steps.
