Figure 5.
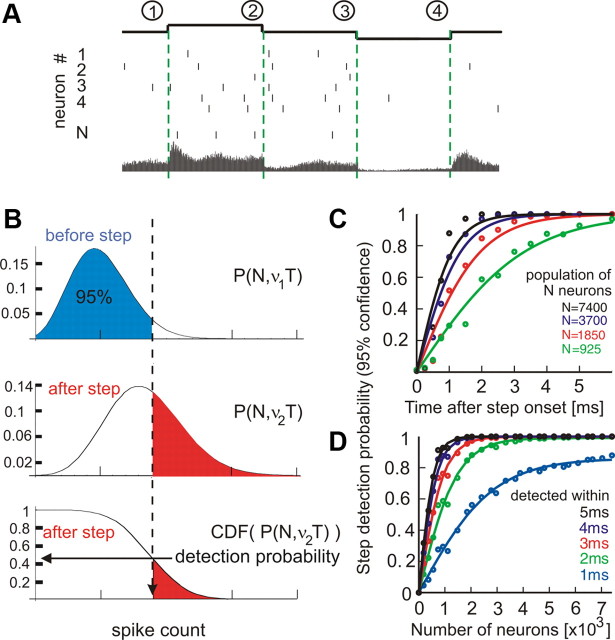
Detection of population firing rate changes induced by changes of the mean input current. A, Illustration of step encoding in the population firing rate of N neurons. Top to bottom, Timing of current steps; spike responses of neurons 1 … N, with vertical bars representing individual spikes and the resulting peristimulus time histogram of the population firing rate (bottom, data from Fig. 1E). B, Illustration of a theoretical decoder. Binomial distributions P(N, v1T) of spike counts before the step, P(N, v2T) after the step and its cumulative distribution CDF(P(N, v2T)). From the latter, the probability that after-step spike count is outside the 95% boundary of the pre-step distribution is determined (horizontal arrow). This corresponds to the probability of step detection with 95% confidence. C, D, Probability of step detection versus time after step onset (C) and number of neurons (D) as calculated from data in Figure 1C–F and averaged across conditions (1–4). Circles denote the data points and solid lines denote fits of the form f(T) = tanh(bT) or f(N) = a tanh(bN), respectively. Note that a population of 7400 neurons (equivalent to the number of realizations) can detect 88% of steps within the first 1 ms.

