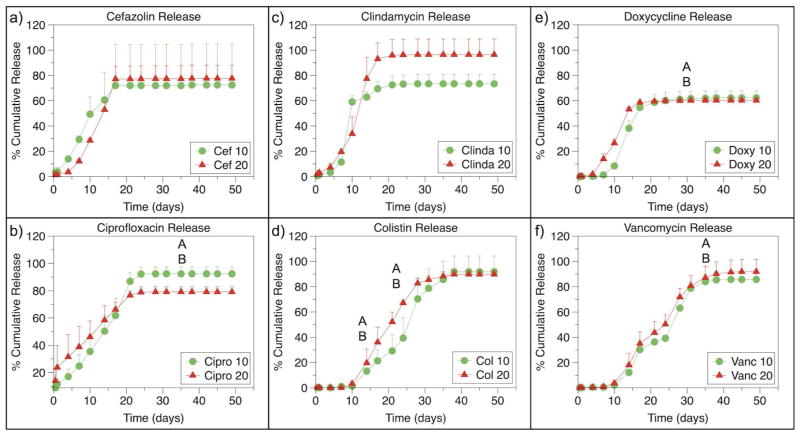
Figure 2.
Release curves for a) cefazolin, b) ciprofloxacin, c) clindamycin, d) colistin, e) doxycycline, and f) vancomycin loaded PLGA microparticles at 10 wt% and 20 wt%. Significant differences between release rates during different phase are indicated by letters. For ciprofloxacin loaded MPs, there is a significant different between 10 wt% and 20 wt% loaded MPs during Phase 1 (p<0.05). For colistin loaded PLGA MPs, Phase 2 and Phase 3 are significantly different between 10 wt% and 20 wt% loaded MPs (p<0.05). Ciprofloxacin and doxycycline 10 wt% loaded MPs demonstrate increased release of antibiotic during Phase 3 compared to 20 wt% loaded MPs, and vancomycin loaded MPs demonstrate increased release from 20 wt% MPs compared to 10 wt% MPs in phase 4 (p<0.05). Cumulative percent release is the same between 10 wt% and 20 wt% for any antibiotic (p>0.05).

