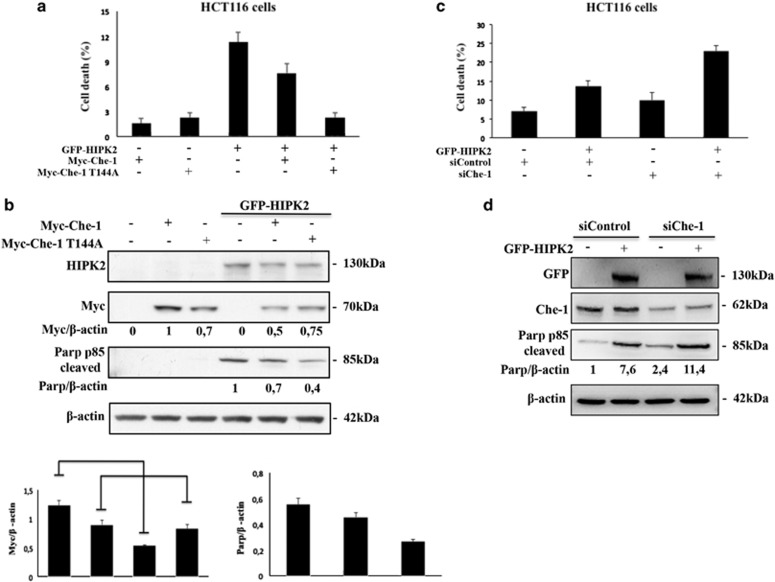
Figure 5.
HIPK2 induces apoptosis by sustaining Che-1 degradation. (a) Cell death analysis of HCT116 cells transfected with Myc-Che-1 or Myc-Che-1T144A in presence or absence of GFP-HIPK2 expression vectors. Twenty-four hours later, cell death was assayed by trypan blue staining, and percentages represent trypan blue-incorporating cells. Columns are average of three independent experiments, and error bars indicate standard deviation. (b) The top panel shows WB analysis of TCEs of a with indicated Abs. In the bottom panels is shown the schematic representation of Myc-Che-1 and Cleaved-PARP protein levels. Columns are average of five independent experiments, and error bars indicate standard deviation. (c) HCT116 cells were transiently transfected with siControl or siChe-1 in the presence or absence of GFP-HIPK2 expression vector. Twenty-four hours later, cell death was assayed as in a. (d) TCEs from c were analyzed by WB with the indicated Abs

