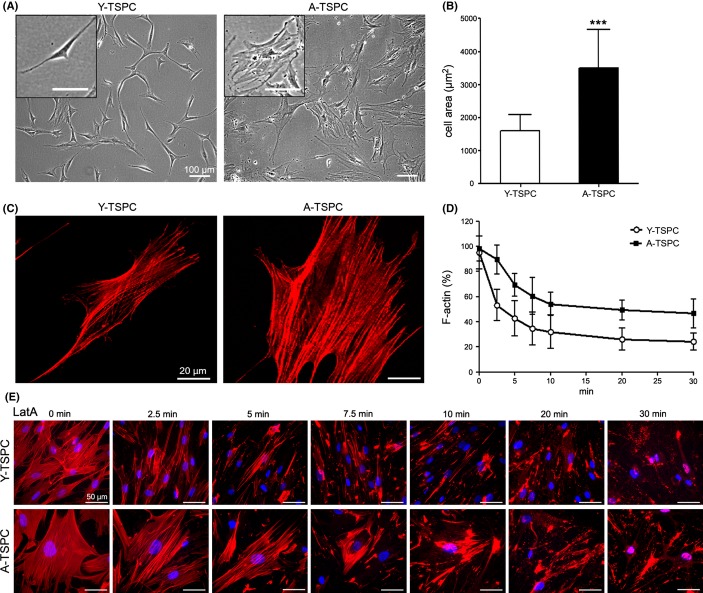
Fig 4.
Comparison of cell size, F-actin organization, and turnover in Y- and A-TSPC. (A) Phase-contrast images at passage 1. (B) Quantification of cell area of three Y-TSPC versus three A-TSPC donors (50 cells per group) grown on plastic dishes. (C) Phalloidin-stained TSPC (actin fibers are in red). (D) Quantification of the F-actin amount in Y- and A-TSPC after Latrunculin A (LatA) treatment. The individual data points show mean ± SD from three different donors per group. (E) Representative images of phalloidin labeling at each time point of the LatA treatment. DAPI (in blue) was used for nuclear staining.

