
Figure 1.
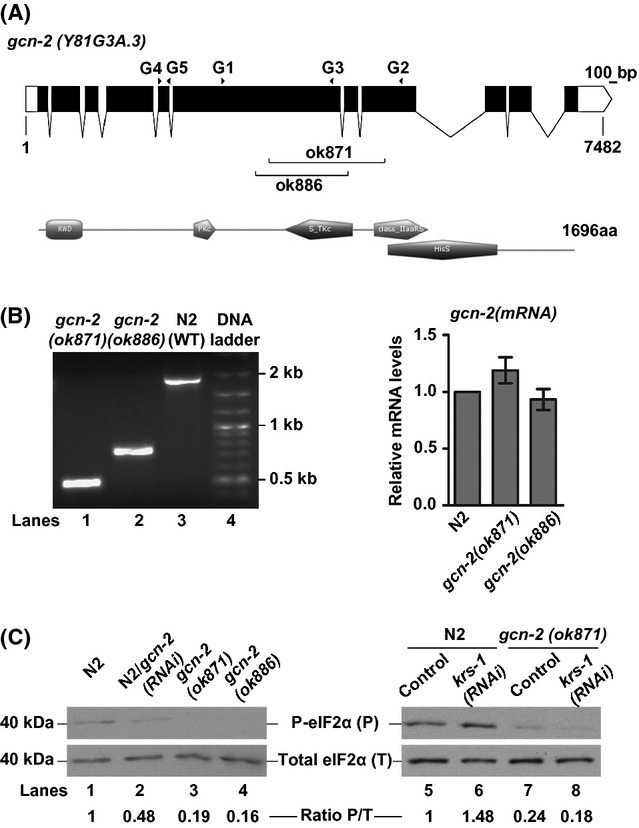
Conservation in gene structure and function of Caenorhabditis elegans gcn-2. (A) Gene structure and predicted protein domains of GCN-2, designed using the Prosite MyDomains (http://prosite.expasy.org/mydomains/): Black boxes represent exons linked by lines corresponding to introns, and white boxes indicate the 5′ and 3′ UTR found in a second alternative isoform (http://www.wormbase.org). The graphic was created using the Exon-Intron Graphic Maker (http://wormweb.org/exonintron). Branches point to the sequences deleted in the two alleles ok871 and ok886. Black arrowheads indicate the position of primers used in this study (Table S2). (B) Reverse transcription (RT)–PCR analysis with primers G1/G2 (shown in A pane) and qRT-PCR analysis with primers G4/G5 (shown in A pane). (C) Western blot analysis showing the levels of phosphorylated (P-eIF2α) normalized by the total amount of eIF2α, in whole worm extracts. Basal levels of P-eIF2α under well-fed conditions in untreated or gcn-2(RNAi)-treated N2 and gcn-2 mutants (left pane). Induced levels of P-eIF2α under amino acid limitation in krs-1(RNAi) treated worms (right pane).