
Figure 2.
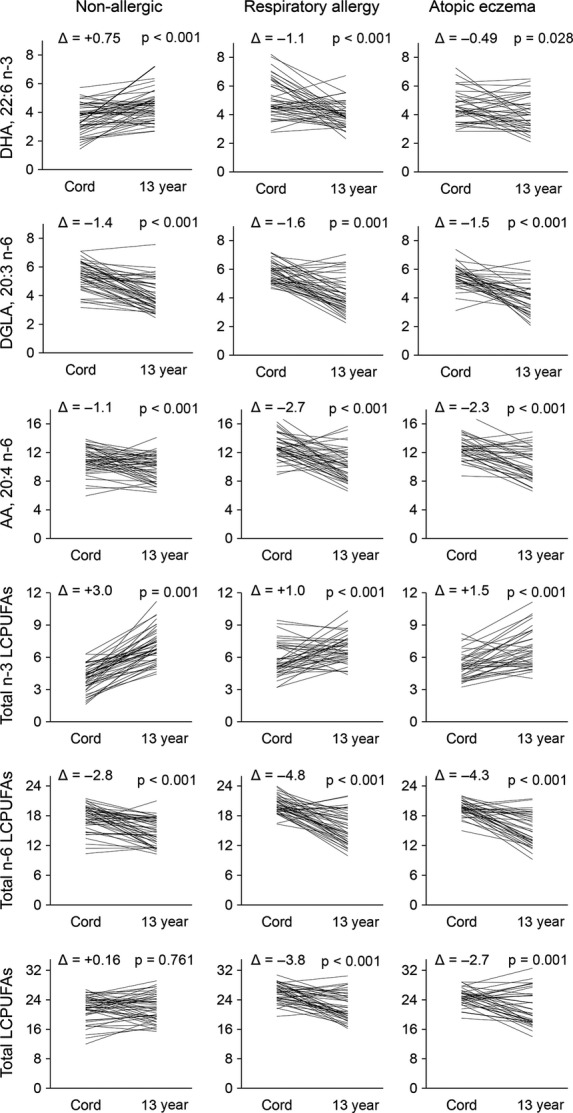
Line chart showing the change of fatty acid proportions in serum phospholipids [% of serum phospholipids] in each individual between cord serum drawn at birth and adolescent serum drawn at 13 years of age for each clinical group. The p-values are from paired t-test. Δ shows the mean difference between proportion in cord serum and proportion in adolescent serum. Abbreviations and explanations: LCPUFA, long-chain polyunsaturated fatty acids; total n-3 LCPUFA, sum of 20:4, 20:5, 22:5 and 22:6; total n-6 LCPUFA, sum of 20:2, 20:3, 20:4, 22:4 and 22:5; total LCPUFA, sum of total n-3 and total n-6 LCPUFA.