Figure 3.

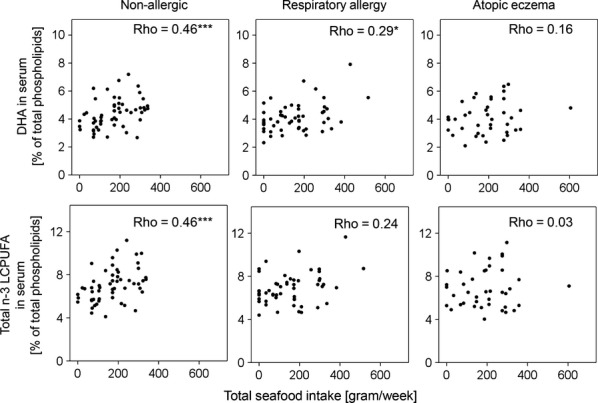
Correlations between intake of total seafood [gram/week] and proportions of DHA and total n-3 LCPUFAs in serum [% of total serum phospholipids] for each studied group. *p ≤ 0.05, ***p ≤ 0.001.

Correlations between intake of total seafood [gram/week] and proportions of DHA and total n-3 LCPUFAs in serum [% of total serum phospholipids] for each studied group. *p ≤ 0.05, ***p ≤ 0.001.