
Figure 4.
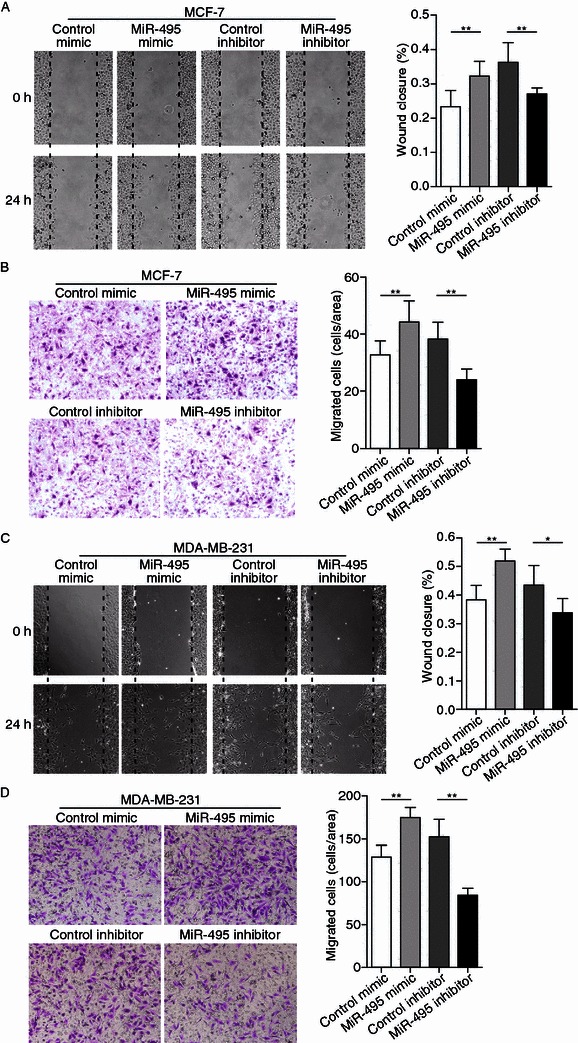
Effects of miR-495 on breast cancer cell migration. (A) Left panel: Representative image of wound healing assay of MCF-7 cells transfected with control mimic, miR-495 mimic, control inhibitor or miR-495 inhibitor. Right panel: Quantitative analysis of the wound closure rates. (B) Left panel: Representative image of Transwell assay of MCF-7 cells transfected with control mimic, miR-495 mimic, control inhibitor or miR-495 inhibitor. Right panel: Quantitative analysis of the migration rates. (C) Left panel: Representative image of wound healing assay of MDA-MB-231 cells transfected with control mimic, miR-495 mimic, control inhibitor or miR-495 inhibitor. Right panel: Quantitative analysis of the wound closure rates. (D) Left panel: Representative image of Transwell assay of MDA-MB-231 cells transfected with control mimic, miR-495 mimic, control inhibitor or miR-495 inhibitor. Right panel: Quantitative analysis of the migration rates. *P < 0.05; **P < 0.01