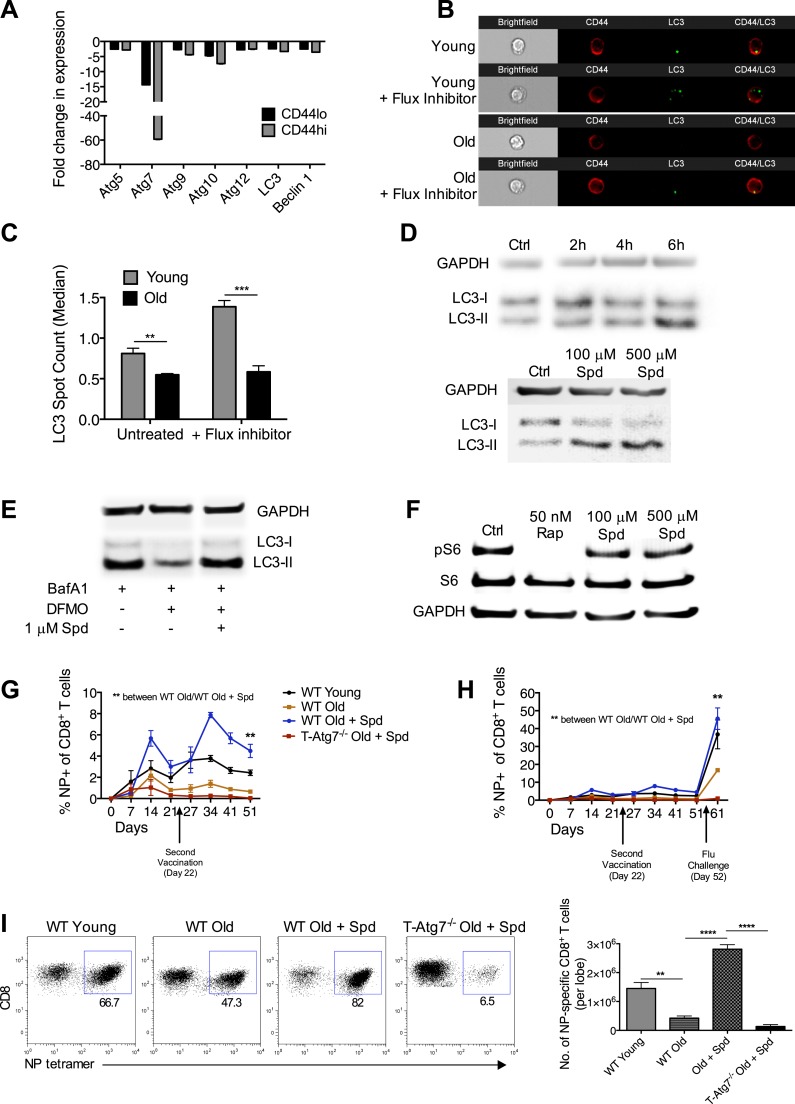
Figure 6. Boosting autophagy restores CD8+ T cell responses to vaccination in elderly mice.
(A) Autophagy gene expression in CD8+ T cells from young and elderly mice. CD44lo and CD44hi CD8+ T cells were purified from 6 week old and 2 year old mice using fluorescent activated cell sorting. mRNA was extracted and the expression of essential autophagy genes was measured by q-PCR. Shown is the fold change in expression in CD8+ T cells from old mice relative to expression in young mice (normalized to gapdh and hprt). (B) LC3 Spot count in CD8+ T cells from young and old mice. Splenic CD8+ T cells from 8 week old and 2 year old mice were treated with an autophagy flux inhibitor for 2 hr, as a control cells were left untreated. LC3 spot count was determined on CD8+ CD44hi T cells using ImageStream. Representative images are shown (×60 magnification). **p = 0.0082, ***p = 0.0004 as determined by Student t-test (n = 4–5). (C) Quantification for images shown in (B). (D) Human T cell line Jurkat was incubated with 100 µM spermidine for 2, 4, or 6 hr or left untreated followed by whole protein extraction for LC3 Western Blot (upper panel). In the lower panel, Jurkat cells were incubated either with no spermidine (control), 100 µM, or 500 µM spermidine for 6 hr and then Western blotted for LC3. GAPDH was used as loading control for all Western blots. (E) Jurkat cells were treated with 1 mM DFMO or 1 mM DFMO with 1 µM spermidine for 48 hr or left untreated (control). In the final 6 hr of incubation, all cells were treated with 10 nM bafilomycin A1 and LC3-I to LC3-II conversion was assessed by Western Blot. (F) Jurkat cells were treated with 50 nM rapamycin, 100 µM or 500 µM spermidine for 6 hr followed by detection of phosphorylated S6 (Ser235/236) by Western Blot. As a control, cells were left untreated. (G) CD8+ T cell kinetics to influenza vaccination in aged mice in the presence of spermidine. 8-week-old young WT and 23 month old WT and T-Atg7−/− mice were vaccinated 22 days apart with S-Flu. 21 days prior to the first vaccination, aged WT and T-Atg7−/− mice were administered spermidine in the drinking water at a concentration of 5 mM through to the experimental endpoint. As a control, 23 month old WT mice were administered water alone. The CD8+ T cell response to NP was tracked over time in the blood by tetramer (n = 4–5). Y-axis depicts the frequency of CD8+ T cells that are specific for NP. **p < 0.01 by Mann–Whitney U-test. (H) CD8+ T cell kinetics to influenza vaccination and challenge in aged mice in the presence of spermidine. 8-week-old young WT and T-Atg7−/− and 23 month old WT and T-Atg7−/− mice were vaccinated as described in (G). 30 days after the last vaccination, mice were challenged with 32 HAU X31 and the CD8+ T cell response to challenge was measured 9 days later in the lungs by tetramer. From 21 days prior to the first vaccination, through to the experimental end point, aged WT and T-Atg7−/− mice were administered spermidine as before. Y-axis indicated the percentage of CD8+ T cells that are specific for NP (n = 4–5). (I) CD8+ T cell response to influenza challenge in vaccinated aged mice in the presence of spermidine. 9 days post–challenge, lungs were harvested and the NP-specific CD8+ T cell response to influenza challenge was measured by tetramer. Example dot plots are gated on CD8+ T cells. Bar chart shows absolute counts of NP-specific CD8+ T cells in the lung per lobe. **p < 0.01, ****p < 0.0001 by Student t test (n = 4–5). All values are mean ± s.e.m.


