. 2014 Nov 11;3:e04387. doi: 10.7554/eLife.04387

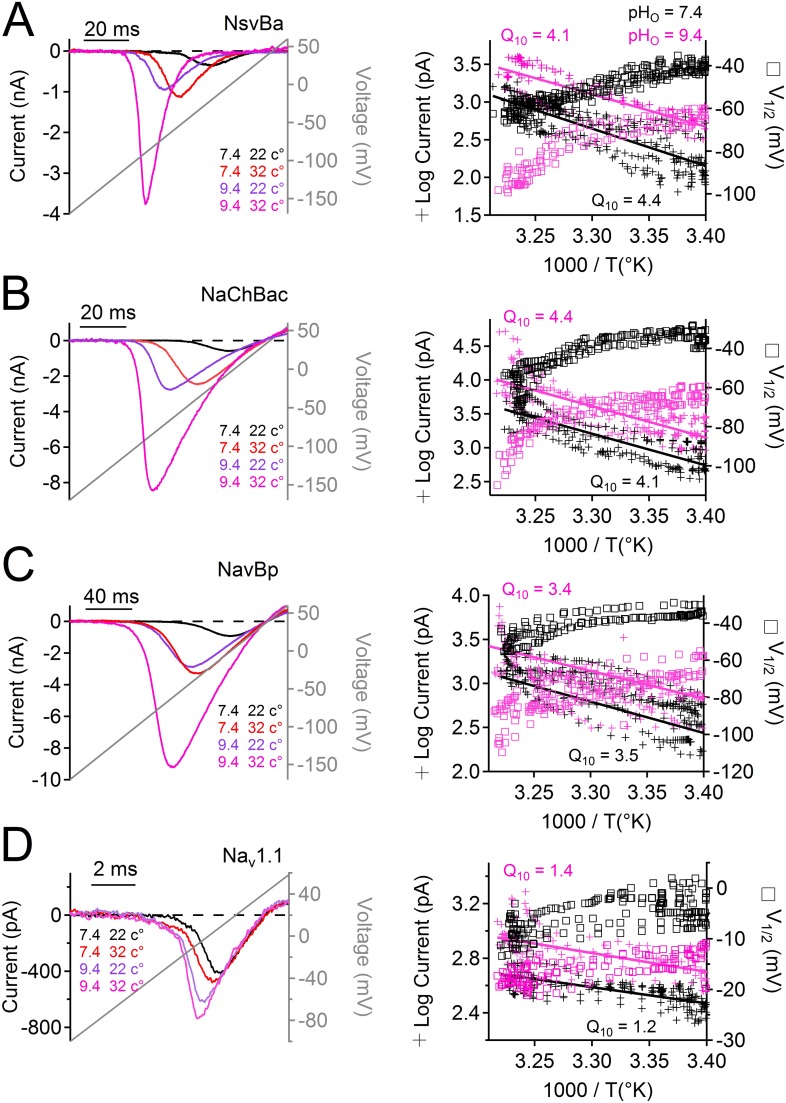
Figure 6. Temperature and pH dependence of sodium channels.

Left Example INa traces conducted by (A) NsvBa, (B) NaChBac, (C) NavBp and (D) Nav1.1 channels, when the extracellular saline (pH = 7.4 or 9.4) was heated from 20 to 37°C. Channels were activated by a 0.5 Hz voltage ramp. Voltage ramps were applied for different durations to compensate for different channel kinetics of activation and inactivation: NsvBa and NaChBac (100 ms); NavBp (200 ms) and Nav1.1 (10 ms). Right, Arrhenius plots with resulting peak current (plus symbols) and V1/2 (open squares) are graphed as a function of temperature. The peak currents were fit to a linear equation and the resulting slope (Peak Q10) given for both external pH conditions (n = 4).

DOI: http://dx.doi.org/10.7554/eLife.04387.014

Figure 6.

Figure 6—figure supplement 1. The effect of temperature and pH on NsvBa selectivity.

Figure 6—figure supplement 1.

(A) Top, Representative NsvBa current traces recorded at 34⁰C under different extracellular cationic conditions with a pH = 9. Currents were activated by increasing potentials from −10 mV to 70 mV from a holding potential of −140 mV. Bottom, Corresponding current–voltage relationships measured under the conditions listed above (n = 4 or 5 for each condition, Error = ±SEM). Peak inward currents were normalized to the Na+ current measured either in 110 or 150 mM extracellular solution. Erev was calculated by fitting the current from 0 mV to 60 mV to a linear equation, and determining the potential at zero current. When corrected for liquid junction potential differences in the salines, Erev under these conditions were 40 mV for 150 mM Na+; 36 mV for 110 mM Na+; 41 mV for 110 mM Ca2+ and 43 mV for 150 mM KCl. (B) The calculated relative permeability for cations measured at 22⁰C and 34⁰C.