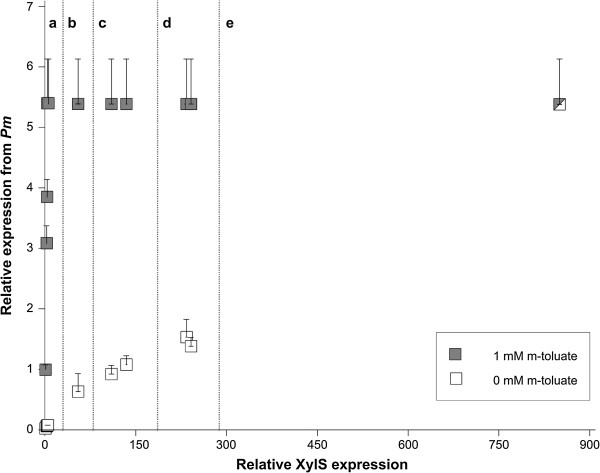
Figure 4.

Effects of XylS expression variations on induced and uninduced Pm activity. Upper host ampicillin tolerance levels as a function of the expression level of XylS in the absence (white squares) and presence (grey squares) of Pm induction (0/1 mM m-toluate). The shape that is half grey and half white represents an identical data point for both induced and uninduced. Relative expression from Pm and relative XylS expression were determined in the same way as described in Figure 3. The data points were collected from cells containing the Pm-bearing plasmid pFS15 in all cases and a: pFZ2B1, inducer concentrations as in Figure 3 (the grey data points are the same as the corresponding points in Figure 3); b: pET16.xylS, 0 mM IPTG; c: pFZ2B2, 0.25 and 0.5 mM cyclohexanone (from left to right); d: pFZ2B3, 0.25 and 0.5 mM cyclohexanone (from left to right); e: pET16.xylS, 0.5 mM IPTG.
