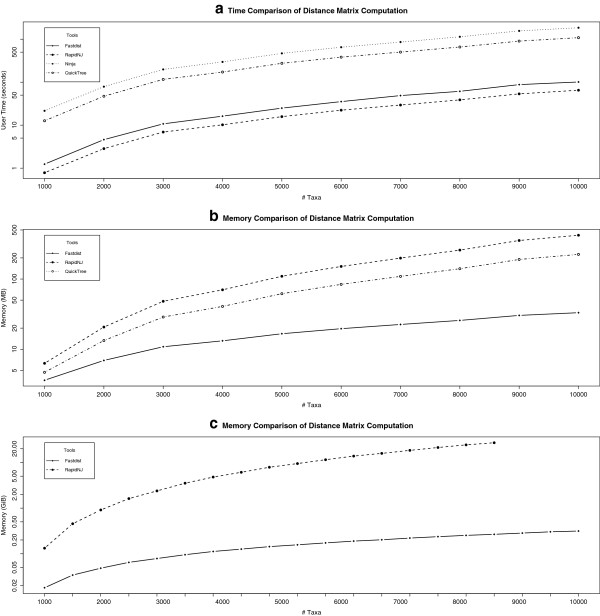
Figure 7.

Time and memory comparison of the distance matrix computation. The analysis in Figure 7a and 7b were performed on dataset-1, while Figure 7c shows the memory utilization of RapidNJ and fastdist (using the binary format) on dataset-2. ClearCut was not considered in this experiment since it outputs the distance matrix as an option, and at the same time it outputs the phylogenetic tree.
