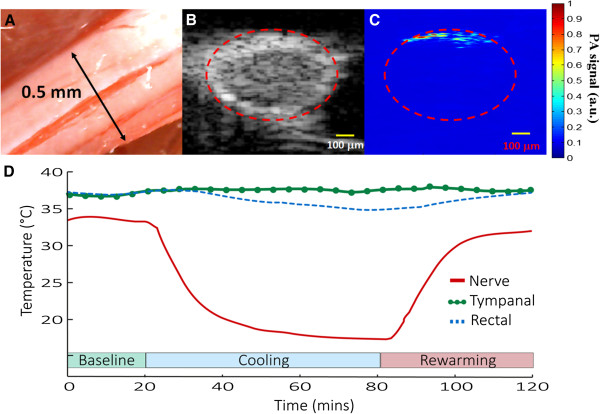
Figure 2.

Cooling protocol for the sciatic nerve. (A) Photograph of the sciatic nerve (about 0.5 mm) showing several blood vessels from the epineurial vascular plexus. (B) Ultrasound and (C) PA cross-sectional B-scan images of the sciatic nerve. The yellow scale bars are equivalent to 100 μm. The ROI with the PA signal changes in scanned sciatic nerve image section was identified by the ultrasound image, as indicated by the red dashed line in (B). (D) Localized nerve thermoregulation protocol, including the baseline, cooling and rewarming. Temperature changes in the sciatic nerve, tympanic and rectal areas were monitored.
