
Fig. 4.
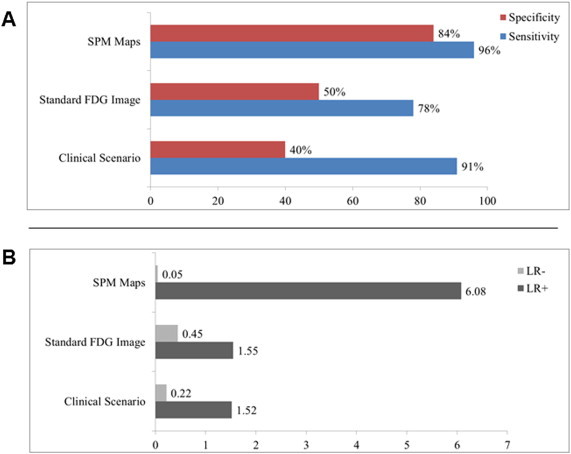
A) Sensitivity (blue) and specificity (red) values of Clinical Scenarios, Standard FDG Image and SPM Maps. B) Positive (LR+) (dark grey) and negative (LR−) likelihood (pale grey) ratio for correct classification of patients, broken down by type of information.