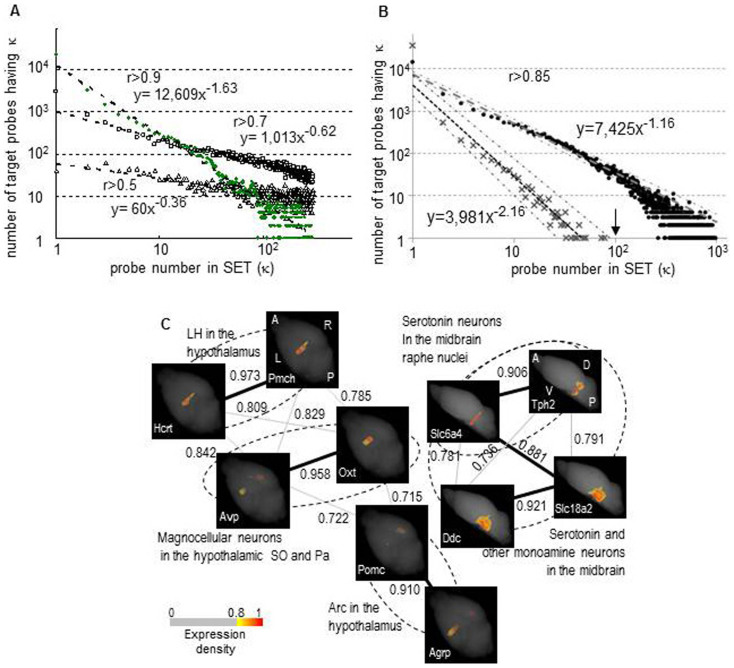
Figure 1. Integrated analysis of graphs of co-expression networks and anatomical maps.
(A) The distribution of probe number in SETs Using the total probes, κ, the probe number in a SET (similarly expressed probes to a target probe) was calculated for each probe with a threshold of r > 0.5, 0.7 and 0.9. The value of κ is shown on the x-axis compared with the number of probes exhibiting κ on the y-axis (Log10 scales). Triangles, squares and green circles represent the results at the three thresholds, respectively. Dotted lines with formulas indicate the power law fit. (B) The distribution of probe number in SETs (κ) calculated in the non-randomized and randomized datasets Using the total probes, κ was calculated for each probe with a threshold of r > 0.85 in the non-randomized dataset that was the fraction data used in Figure A, and in the computationally randomized dataset (see Methods). The distributions of κ were then plotted in the same way as in figure A. Closed circles and cross marks represent the results of non-randomized and randomized datasets, respectively, and dashed lines and dotted lines with formulas indicate their respective power law fits: 95% confidence intervals are shown with chain lines, indicating that the κ distributions in the two datasets are significantly distinguished throughout the range of Log10 κ > 0. Probes accompanied by κ > 100 are only present in the non-randomized dataset (κ = 100 indicated with an arrow). (C) Graphs of co-expression networks of genes that are expressed in regions of the hypothalamus and the midbrain Ten genes that are expressed in regions of the hypothalamus and the midbrain were selected through a literature search, and graphs of their co-expression networks (r > 0.7) were depicted using a stochastic algorithm16. Three-dimensional expression maps are shown at the node positions, and the gene symbols are given at the bottom left. The map orientation is the same within a graph: A anterior, P: posterior, L: left, R: right, D: dorsal and V: ventral. The node positions of the genes that are selectively expressed in a type of cells are close in the graph. Consequently, the graphs represent anatomical and functional regions, as indicated by dotted lines and names12,13,14,15. Thick and thin lines: r > 0.85 and > 0.7, respectively, show that r > 0.85 is sufficiently high to reveal groups of genes that are present in particular regions or cell types. Abbreviations: LH: lateral hypothalamus, SO: supraoptic nucleus, Pa: paraventricular hypothalamic nucleus, Arc: arcuate nucleus. The scale for pseudo-colored expression densities with the cut-off filter is shown.

