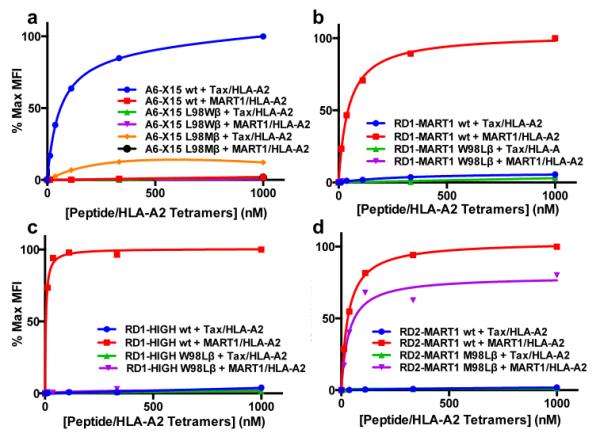
Figure 5. Binding analysis of position 98β mutants of selected TCRs.

Binding titrations of the indicated mutants of A6-X15 (a), RD1-MART1 (b), RD1-MART1HIGH (c), and RD2-MART1 (d). Mutants were stained with 12.3 nM, 37.0 nM, 111 nM, 33 nM, and 1 μM Tax and MART/HLA-A2 PE-conjugated streptavidin tetramers. Normalized percent max MFI is plotted against peptide/HLA-A2 tetramer concentration. This experiment was also performed with pepMHC-Ig dimers with similar results (Supplementary Fig. 9).
