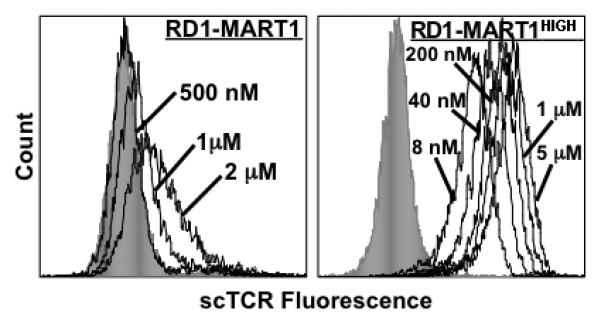
Figure 6. Binding of soluble TCRs to antigen presenting cells.

T2 cells were loaded with Tax or MART1, followed by incubation with biotin-labeled RD1-MART1 (left) or RD1-MART1HIGH (right) scTCRs at the indicated concentrations. The shaded gray histograms show staining with Tax-loaded T2 cells at the maximum concentration of TCR for each experiment (2 μM and 5 μM, respectively). Data is representative of 2 experiments with similar results.
