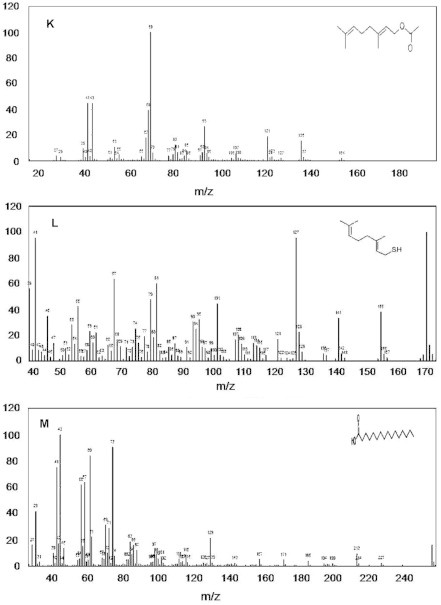
Figure 3.


Mass spectra of 13 compounds, with structures as an insert in individual figures. (A) cyclohexanol, 2-methylene-5-(1-methylethenyl); (B) 2,6-octadien-1-ol, 3,7-dimethyl-, (E)-; (C) 2,6-octadienal, 3,7-dimethyl-; (D) phenol, 5-methyl-2-(1-methylethyl)-; (E) phenol, 2-methoxy-4-(2-propenyl)-; (F) 2,6-octadien-1-ol, 3,7-dimethyl-, acetate, (E)-; (G) diethyl phthalate; (H) tetradecanoic acid; (I) benzyl benzoate; (J) 1,6-octadien-3-ol, 3,7-dimethyl; (K) 2,6-octadien-1-ol, 3,7-dimethyl-, acetate, (E)-; (L) (E)-3,7-dimethylocta-2,6-diene-1-; and (M) hexadecanoic acid.
