
Figure 5.
Methylation Analysis of FBCs with Reduced Dosage of TCF4 and EHMT1
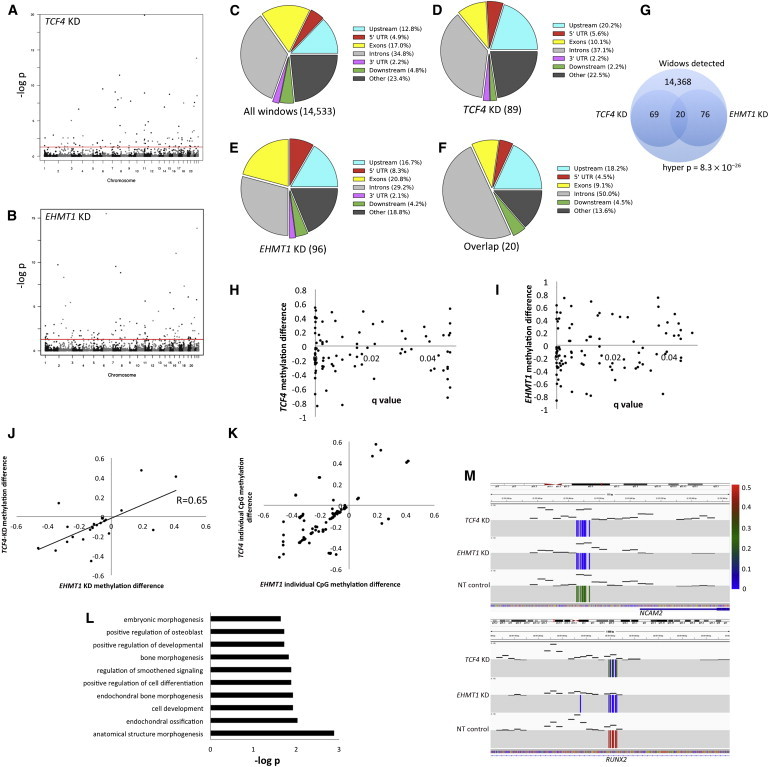
(A and B) Manhattan plots showing genomic regions with genome-wide-significant differential methylation in reduced-dosage FBCs. This analysis was done with 500 bp windows and by assessment of the mean methylation per CpG in the interval. The red lines represent q value = 0.05 (i.e., genome-wide-corrected p values).
(C) Genomic distribution of 500 bp windows observed (i.e., at least two CpGs detected in all cell groups) in RRBS.
(D) Genomic distribution of DMRs from FBCs with reduced TCF4 dosage.
(E) Genomic distribution of DMRs from FBCs with reduced EHMT1 dosage.
(F) Genomic distribution of DMRs common to FBCs with reduced dosage of TCF4 and EHMT1.
(G) Venn diagram of statistical assessment of overlapping DMRs in TCF4 KD and EHMT1 KD.
(H and I) Dot plots showing the relationship between p value and direction of change (either hyper- or hypomethylated) for FBCs with reduced dosage of TCF4 or EHMT1.
(J) Correlation analysis of those DMRs common to FBCs with reduced dosage of EHMT1 and TCF4.
(K) Plot of all individual CpGs that contribute to each cluster plotted in (J); each dot represents a single CpG site.
(L) GO analysis for DMRs common to FBCs with reduced dosage of TCF4 and EHMT1.
(M) Integrative Genomics Viewer (IGV) image showing two examples of DMRs common to FBCs with reduced dosage of TCF4 and EHMT1. Compared to nontarget (NT) controls, both reduced-dosage cell lines were hypomethylated. Each individual colored line reflects a single CpG at this locus, and black dashes represent read coverage over the region (the scale is set from 0 to 100 reads). The colored scale bar refers to methylation frequency.