
Figure 6.
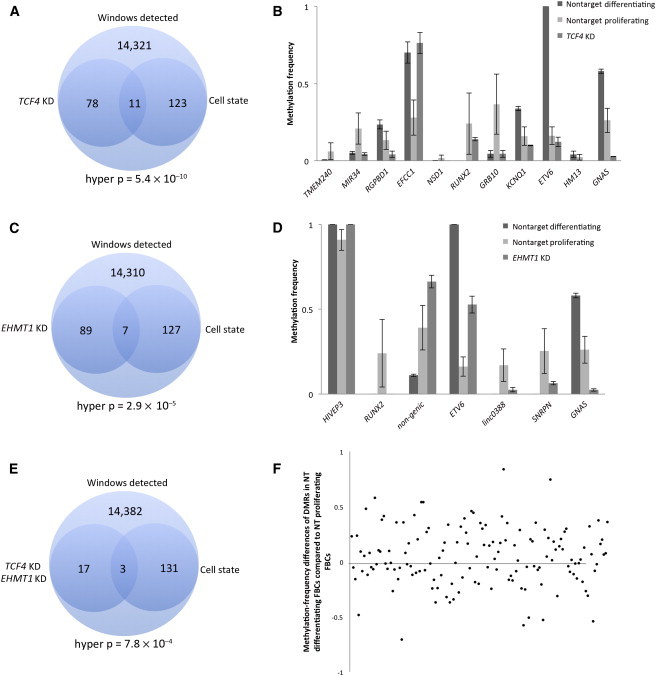
Comparison of Methylation Patterns in Differentiating and Proliferating Nontarget Control FBCs and FBCs with Reduced Dosage of EHMT1 and TCF4
(A) Venn diagram showing the overlap of DMRs identified in the TCF4-KD and the cell-state experiments. The analysis included a total of 14,533 windows.
(B) Genomic region in which the 11 DMRs from (A) were located, as well as the mean methylation level for each.
(C) Venn diagram showing the overlap of DMRs identified in the EHMT1-KD and cell-state experiments.
(D) Genomic region in which the seven DMRs were located, as well as the mean methylation level for each analysis.
(E) Venn diagram showing the overlap of DMRs that intersected the TCF4-KD, EHMT1-KD, and cell-state experiments.
(F) Distribution of methylation-frequency differences of 134 DMRs in the cell-state experiment.