
Figure 7.
DNA-Binding Analysis of FBCs with Reduced Dosage of TCF4 and EHMT1
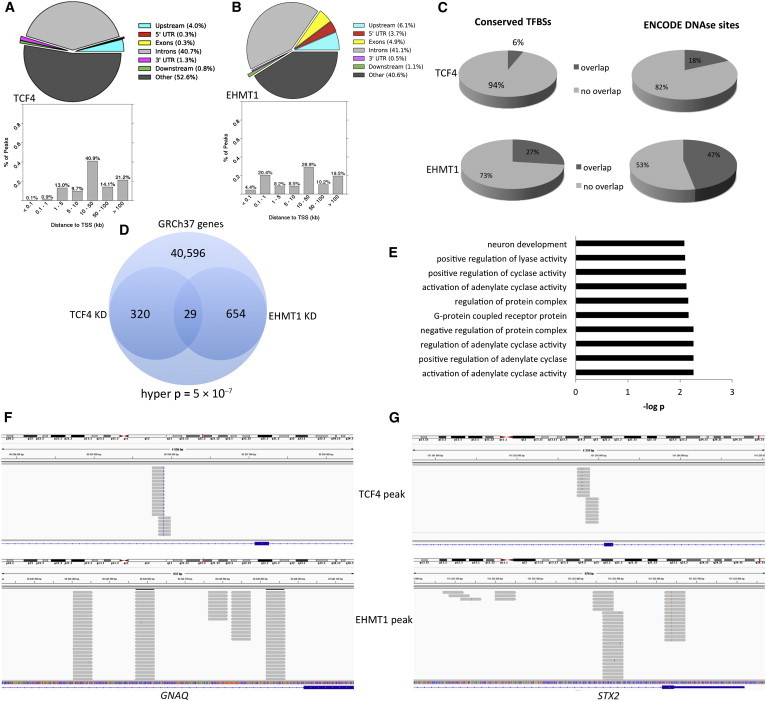
(A) Genomic distribution of peaks from TCF4 ChIP-seq (colored pie chart); the bar graph represents the distribution of TCF4 ChIP peaks from the nearest TSS and was generated with ChIP-Enrich.
(B) Genomic distribution of peaks from EHMT1 ChIP-seq (colored pie chart); the bar graph represents the distribution of EHMT1 ChIP peaks from the nearest TSS.
(C) Pie chart showing the degree of overlap among ChIP peaks, conserved transcription factor binding sites (TFBSs), and ENCODE DNase hypersensitivity sites from the H1 stem cell line.
(D) Venn diagram showing the degree of overlap between TCF4 ChIP peaks and EHMT1 ChIP peaks in the same genes. Hyper p refers to the cumulative hypergeometric p value.
(E) GO analysis of the 29 overlapping genes common to both TCF4 and EHMT1 ChIP peaks.
(F and G) IGV images showing ChIP peaks from TCF4 and EHMT1. Peaks are in different regions of the same gene and show different binding patterns. Grey bars represent sequencing reads, and blue represents the gene of interest.