
Figure 1.
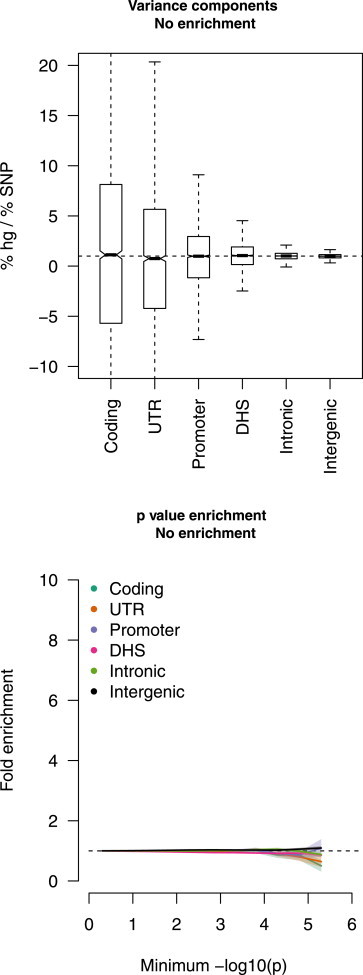
Estimates of Functional Enrichment under the Null
We simulated a polygenic disease architecture in imputed data with no functional enrichment (see text). Simulated phenotypes were tested with the variance-component method (top) from 3,000 simulations and with p value enrichment (bottom) from 100 simulations. In the variance-component subplot, the thin line represents the median, boxes represent the first and third quartiles, and whiskers represent the 1.5× interquartile range from the first to the third quartile. A subplot of p value enrichment shows 1.96× SE as shaded regions.