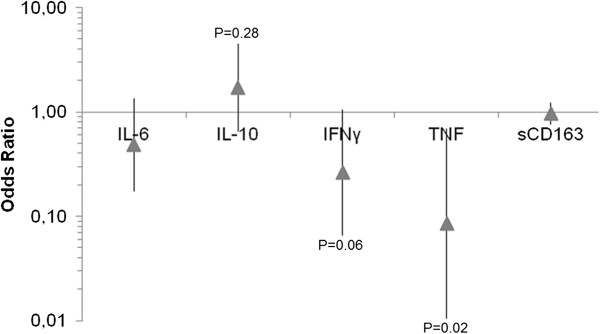
Figure 5.

Odds ratio of inflammatory mediators in relation to the Hp2-2 phenotype. The odds ratios from the multiple regression analysis for the different cytokines are depicted, adjusted for Hp. The odds ratios are represented for the Hp2-2 phenotype relative to the Hp1-1 phenotype. The arrow represents the odds ratio estimate and the error bars represents 95% CI.
