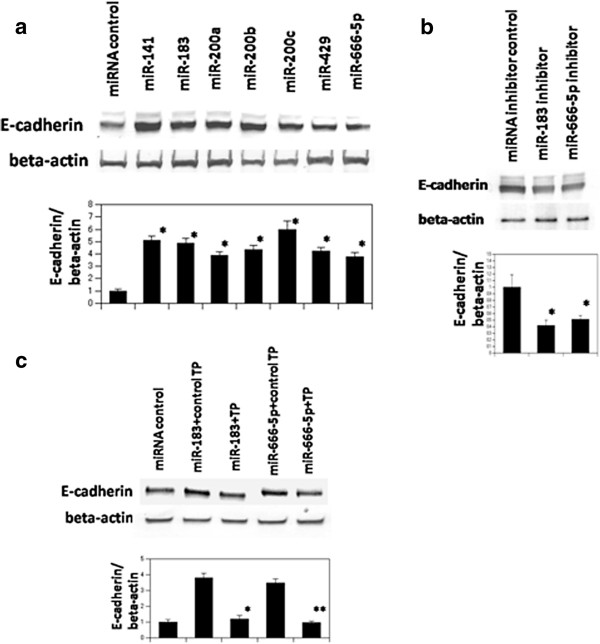
Figure 2.

Western blotting of E-cadherin. (a) Western blotting of E-cadherin in NIH3T3 cells transfected with control miR or Pre-miR™. Precursor Molecules individually. *p < 0.05, compared to cells transfected with Pre-miR™ miRNA Precursor Molecules-Negative Control. (b) Western blotting of E-cadherin in NIH3T3 cells transfected with Anti-miR™ miRNA Inhibitor against miR-183 and miR-666-5p. *p < 0.05, compared to cells transfected with Anti-miR™ miRNA Inhibitor-negative control. (c) Western blotting of E-cadherin in NIH3T3 cells transfected with Pre-miR™ Precursor Molecules for miR-183 or miR-666-5p precursors and each Script Target Protector. *p < 0.05, compared to cells transfected with Pre-miR™ Precursor Molecules for miR-183 and miScript target protector-negative control, **p < 0.05, compared to cells transfected with re-miR™ Precursor Molecules for miR-666-5p and miScript target protector-negative control. The data are mean ± S.D. of triplicates and expression levels of E-cadherin were normalized to beta-actin with further normalization to the negative control.
