
Figure 6.
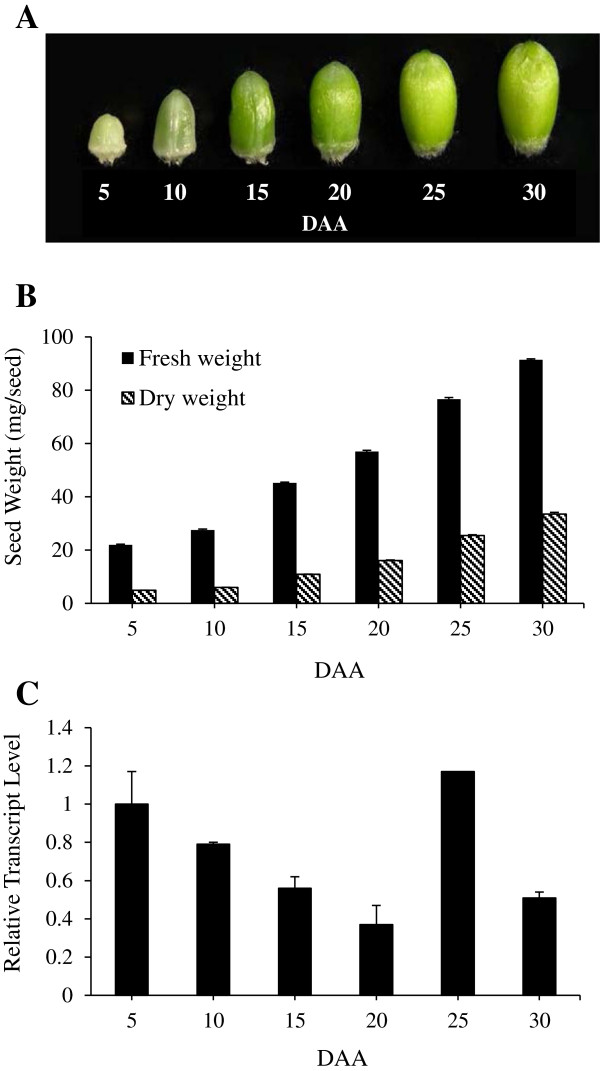
Developing wheat seeds and the total expression of TaSUT2. Seeds at 5, 10, 15, 20, 25 and 30 DAA (A) and their fresh and dry weights (B). Data are means ± SE, n = 20. Relative abundance of TaSUT2 transcript in the same wheat seed samples (C). Transcript levels were determined after normalization with actin as the reference gene, and then expressed relative to that in 5 DAA seed samples, which was arbitrarily set to a value of 1. Data are means ± SE, n = 2 to 3.