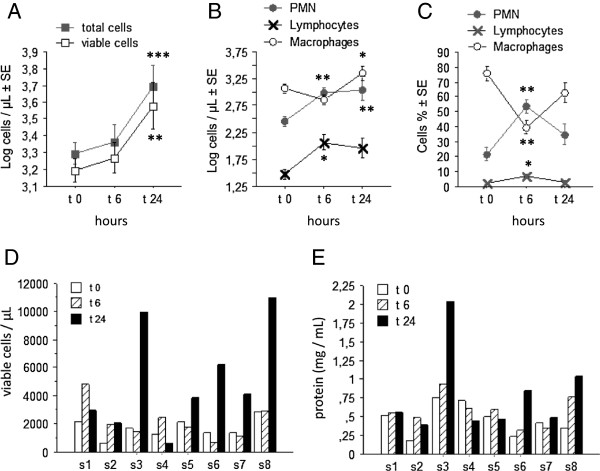
Figure 1.

The sputum cells response induced by LPS. A: The mean values of the total and viable cell count. B and C: the mean changes of the cells differential (expressed in absolute (B) and relative (C) values) before, 6 and 24 hours after LPS inhalation. D/E: The individual changes of the total viable cell count (D) and of the concentration of proteins (E) from the sputum, before, 6, 24 hours and 7 days after LPS inhalation. Results are expressed as means (±SE). Statistics: paired t-tests. * p > 0.05; ** p < 0.02; *** p < 0.01.
