
Figure 3.
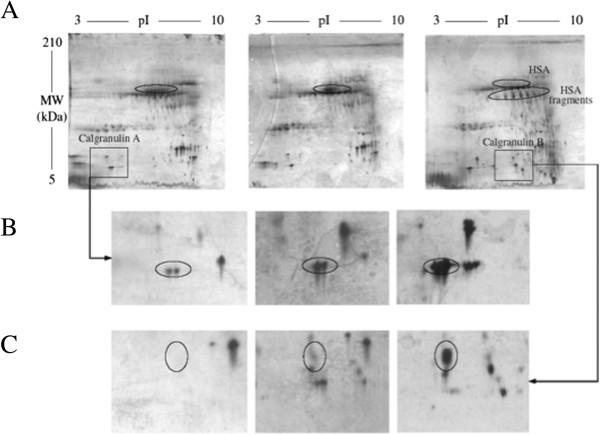
The 2DE analysis of LPS induced sputa. Samples collected after different recovery time (0, 6 and 24 hours) after LPS inhalation were analyzed by 2DE and compared. This analysis clearly shows HSA degradation (A) and a rise in calgranulin A and B abundance (B and C).