
Figure 3.
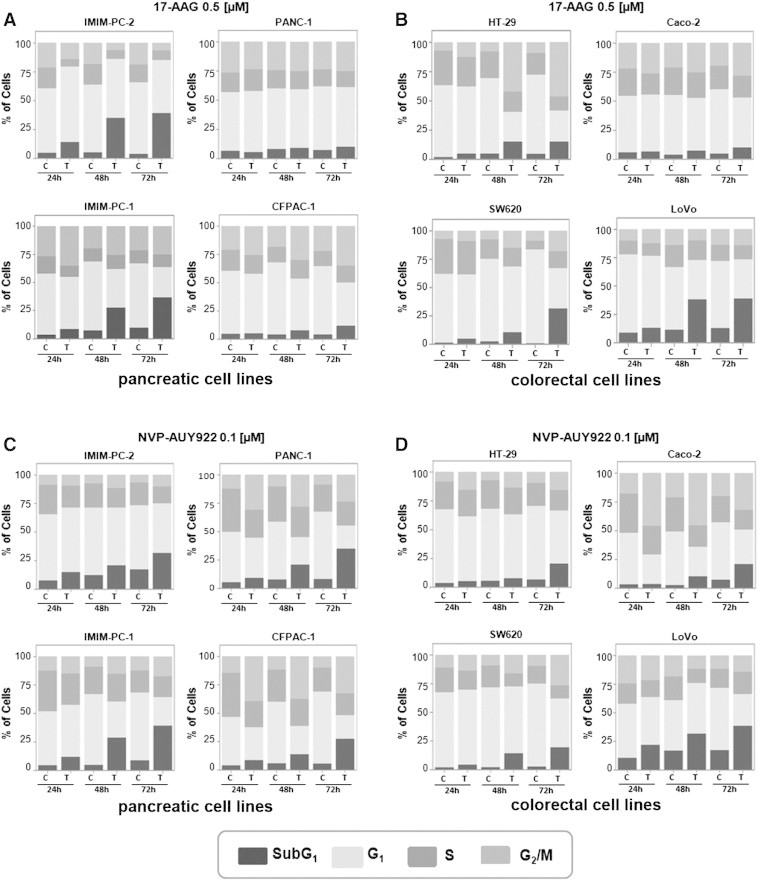
17-AAG and NVP-AUY922 effects on cell death. (A and C) Pancreatic cell lines IMIM-PC-2, IMIM-PC-1, CFPAC-1, and PANC-1 and (B and D) colorectal cell lines HT-29, SW620, LoVo, and Caco-2 were grown and treated with DMSO, 0.5 μM 17-AAG (A and B), or 0.1 μM NVP-AUY922 (C and D) for 24, 48, or 72 hours, and cell cycle distribution of DNA content was determined by flow cytometry. The sub-G1 phase, indicative of cell death, is represented as percentage of control and is the average of at least three separate experiments.