
Figure 2.
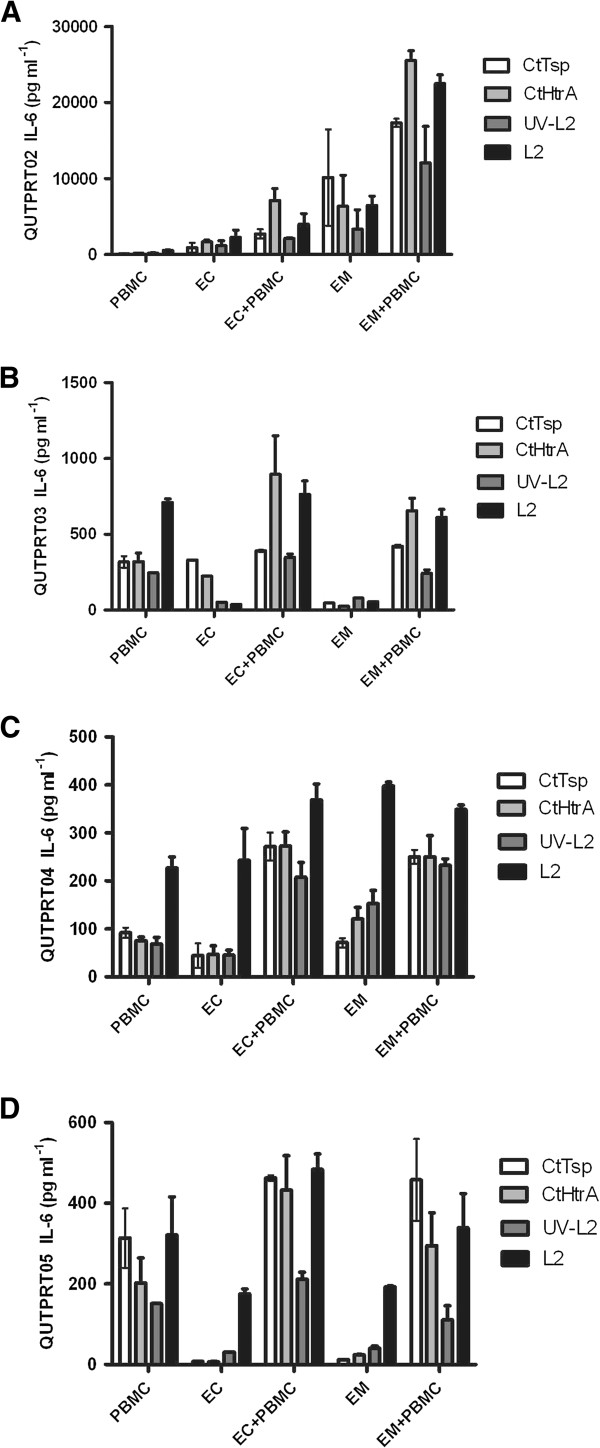
IL-6 responses in primary cultures of hysterectomy tissue. IL-6 response detected from primary reproductive cell culture from four separate participants. The graphs show the cellular responses to CtHtrA, CtTsp, live Chlamydia and UV-killed Chlamydia from endometrial, endocervical, and PBMC primary cultures from human participants. There was a significant variation in the amount of IL-6 secreted; therefore each participant’s data has been shown as separate graphs. A) Participant code QUTPRT02, B) Participant code QUTPRT03, C) Participant code QUTPRT05 and D) Participant code QUTPRT05. Each sample IL-6 value has been corrected for mean baseline of IL-6 from unstimulated cells (n = 2 repeats for each sample).