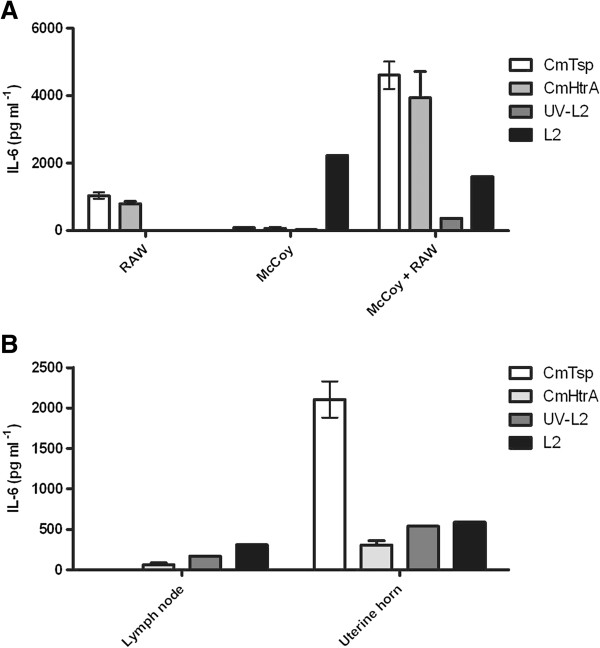
Figure 5.

Mouse cells produce IL-6 in response to the chlamydial stress response proteases and Chlamydia. A) The figure shows the IL-6 production from mouse laboratory cell culture mono-layers with McCoy and co-culture with RAW264.7 cells in response to the stimulants. B) The graph shows the IL-6 production by primary uterine horn and caudal lymph node mouse cell culture in response to the stimulants. Stimulants are indicated to the right of each graph by the shaded bars (n = 2).
