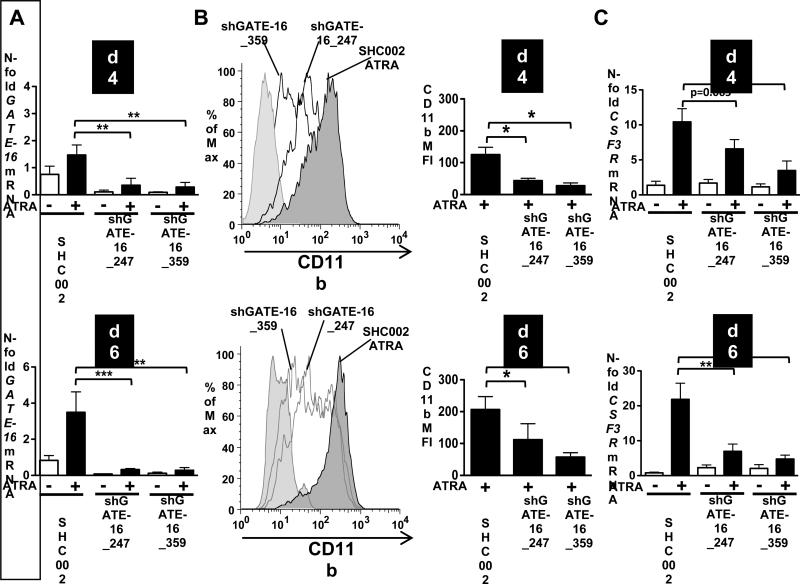
Figure 3. Impaired neutrophil differentiation in NB4 GATE-16 knockdown cells.
(A) GATE-16 mRNA expression was measured upon ATRA (1μM) administration in NB4 cells expressing non-targeting shRNA (SHC002) or shRNAs targeting GATE-16 (shGATE-16_247 and shGATE-16_359) at day 4 and 6, respectively. Values were calculated as described in Fig.1. (B) SHC002, shGATE-162_247 and shGATE-16_359 expressing NB4 cells were differentiated for 4 and 6 days and neutrophil differentiation was assessed by measuring CD11b surface expression. A representative CD11b histogram is shown in the upper panel. Bar graphs of the mean fluorescence intensity of 4 independent experiments are shown. (C) CSF3R mRNA was measured using qPCR in SHC002, shGATE-16_247 and shGATE-16_359 expressing NB4 cells upon 1μM ATRA treatment for 4 and 6 days, respectively. M.W.U, *p<0.01. **p<0.001, *** p<0.0001.

