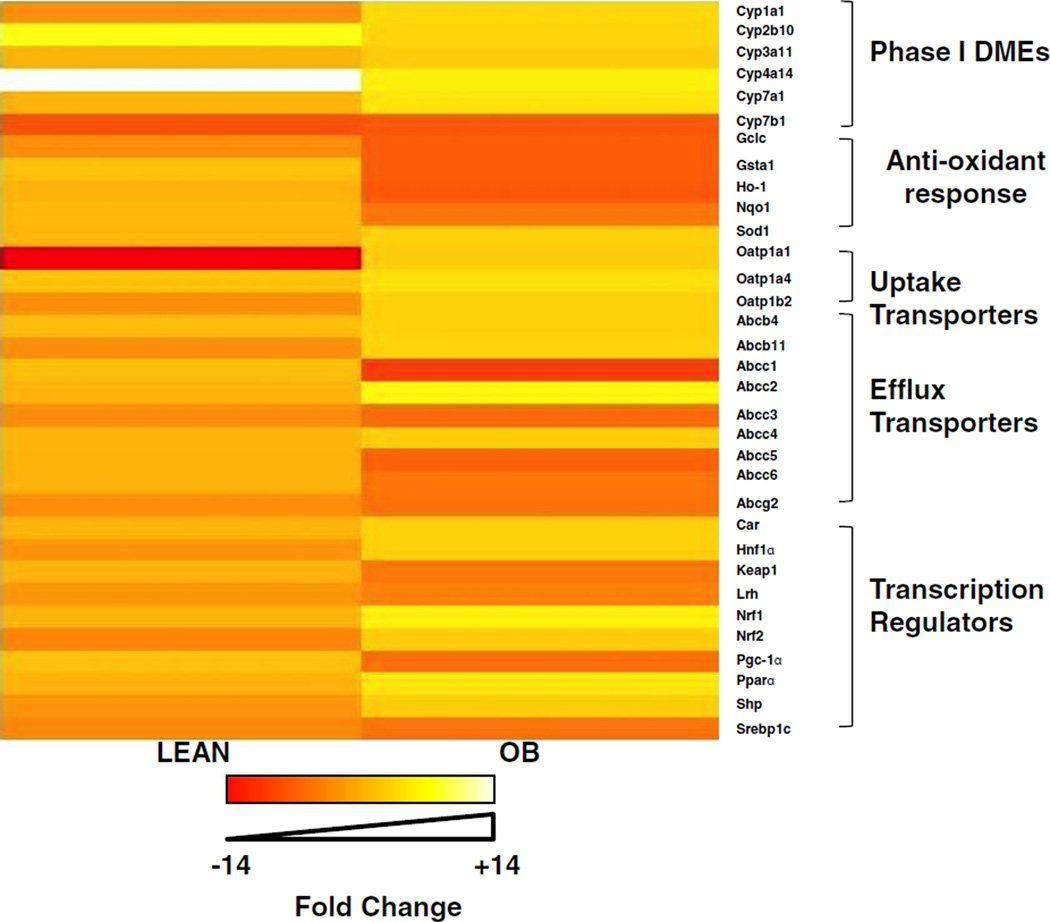
Fig. 2.
Heatmap analysis of biotransformation enzyme and transporter expression patterns in lean and obese mouse livers after CR. Total RNA was isolated from lean and OB mouse livers after CR and Phase I, Phase II biotransformation enzyme, and transporter expression was determined using the the Branched DNA signal amplification assay. Heat maps represent the spectrum of fold change compared to ad libitum fed mice, spanning from −14 to +14 fold.

