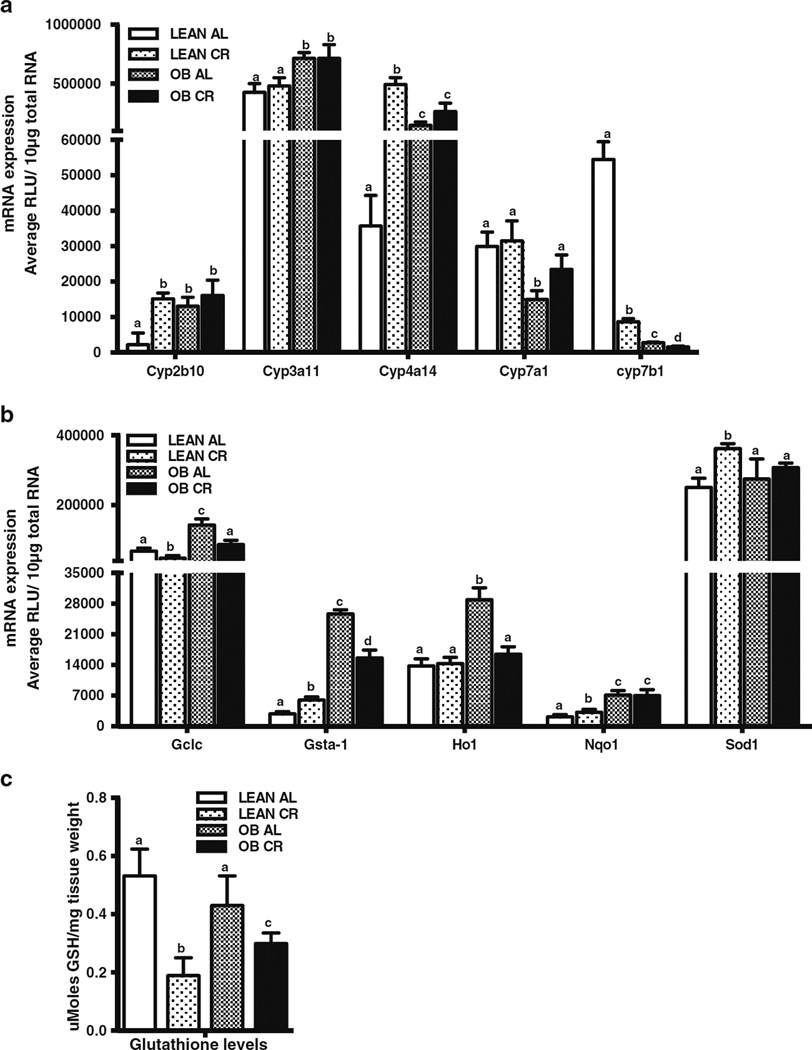
Fig. 3.
Effect of CR on expression of Phase-I and-II biotransformation enzymes and antioxidant genes in lean and obese mouse livers. mRNA expression was quantified by the Branched DNA signal amplification assay. (a) Expression of Phase-I biotransformation enzymes in lean and OB mouse livers after CR. (b) Changes in expression of Phase-II biotransformation antioxidant enzymes in lean and OB mouse livers after CR. The data is represented as average ± SEM (n =7 for AL and n =10 for CR). Means with the same letter are not significantly different from each other (P <0.05). (c) Effect of CR on hepatic glutathione (GSH) levels in lean and OB mice. The data is represented as average ± SEM moles GSH/mg tissue (n =7 for AL and n =10 for CR). Groups without a common letter are considered significantly different from each other (p ≤0.05).

