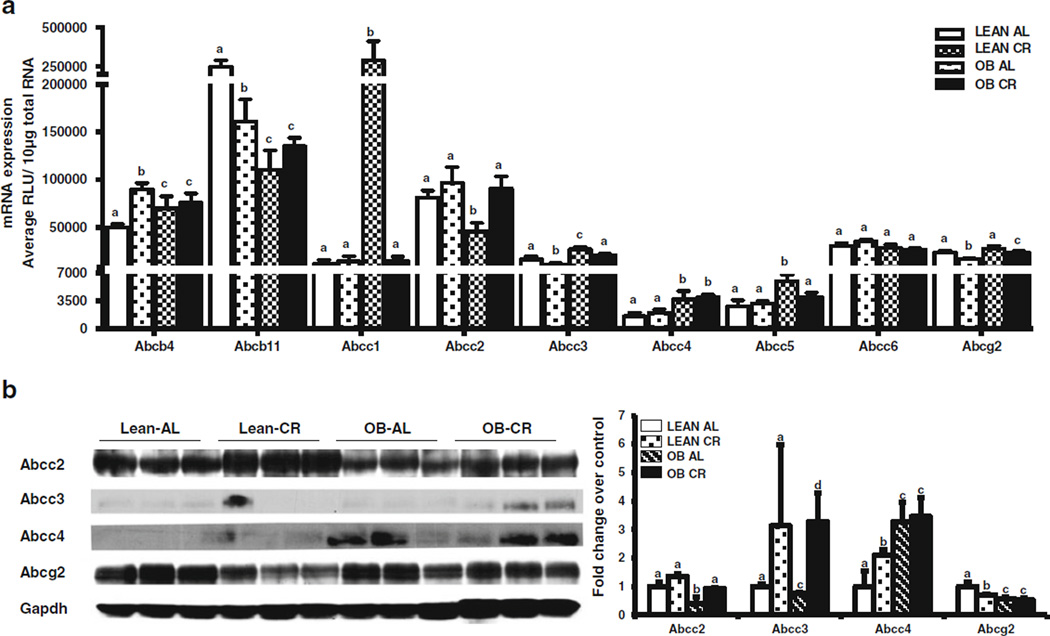
Fig. 5.
Effect of CR on liver efflux transporter mRNA and protein expression in lean and obese mice. (a) Abcb4, Abcb11, Abcc1–6, Abcg2 mRNA was quantified by the Branched DNA signal amplification assay. The data is represented as mean relative light units (RLU)/10 µg total RNA ± SEM (n =7 for AL and n =10 for CR). (b) Relative Abcc2–4 and Abcg2 protein expression quantified by western blot. The data is representative of three individual protein quantifications. Groups without a common letter are considered significantly different from each other (p ≤0.05).

