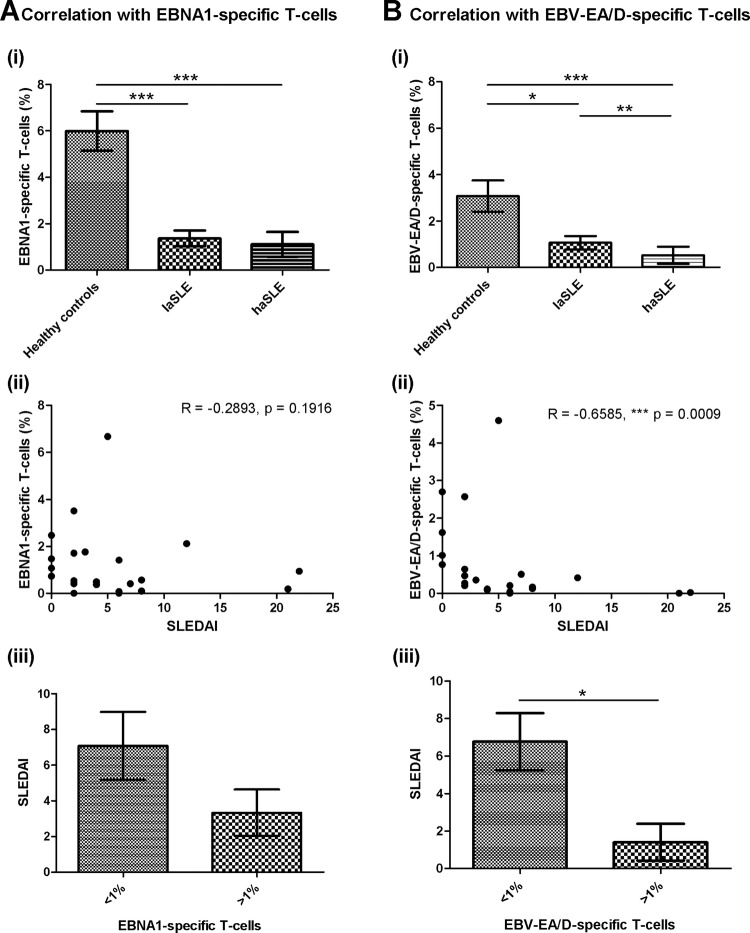
Figure 5.
Correlations of EBV-specific T-cells and disease activity of SLE patients. Correlation analyses between disease activity and EBNA1-specific T-cells (CD69-expressing T-cells upon stimulation) (A) and EBV-EA/D-specific T-cells (CD69-expressing T-cells upon stimulation) (B) in SLE patients (n=22). A(i)+B(i) EBNA1-specific T-cells (A(i)) and EBV-EA/D-specific T-cells (B(i)) in healthy controls, laSLE and haSLE patients presented as mean±SEM. p Values for comparison of healthy controls/laSLE, healthy controls/haSLE and laSLE/haSLE are 0.0004, <0.0001 and 0.1468, respectively, regarding EBNA1-specific T-cells (A(i)) and 0.0328, <0.0001 and 0.0062, respectively, regarding EBV-EA/D-specific T-cells (B(i)). A(ii)+B(ii) Spearman's correlation coefficients are −0.2893 (p=0.1916) and −0.6585 (p=0.0009) when correlating SLEDAI score of SLE patients with EBNA1-specific (A(ii)) and EBV-EA/D-specific T-cells (B(ii)), respectively. A(iii)+B(iii) Comparison of SLEDAI score of SLE patients with less and more than 1% of T-cells being EBNA1-specific (p=0.1129) (A(iii)) and EBV-EA/D-specific (p=0.0195) (B(iii)). laSLE, low-activity systemic lupus erythematosus; haSLE, high-activity systemic lupus erythematosus; SLEDAI, SLE disease activity index; EBNA1, Epstein–Barr virus nuclear antigen 1; EBV-EA/D, Epstein–Barr virus early antigen diffuse.

