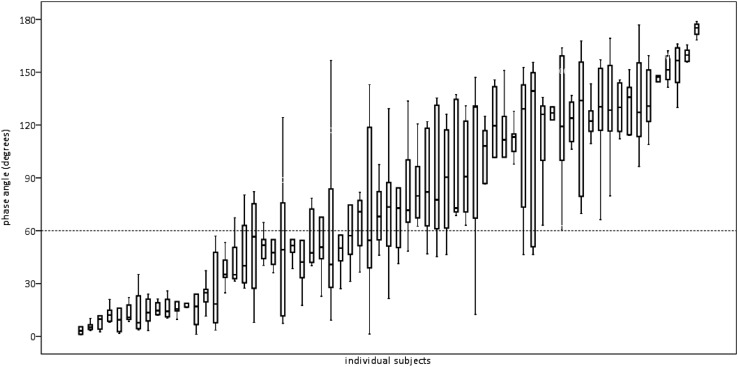
Figure 2.
Φ results for all breaths for each of 65 subjects. Plotted are the medians and the 25th and 75th percentiles with ranges. Of the 65 infants, 50 had 60 acceptable breaths and 15 had fewer than 60 acceptable breaths (median, 50 breaths; range, 19–58 breaths). Line at 60° is drawn to provide a magnitude context for these results by showing the mean value for Φ derived from a published report on infants with CLD and is not meant to indicate a cut point for normal versus abnormal (14). Indeed, the intent in assessing RIP is to validate a continuous variable.

