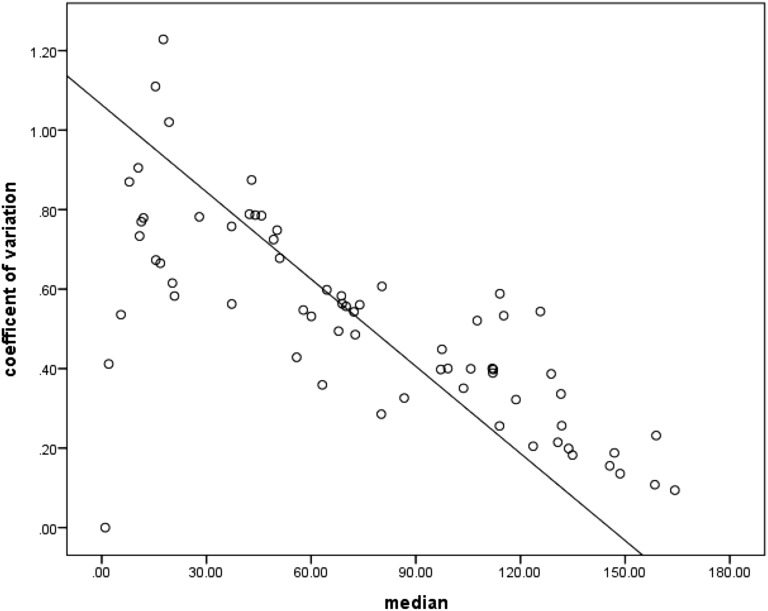
Figure 3.
Coefficients of variation in Φ are plotted versus the median Φ for the breaths chosen. This figure illustrates that the variability shown in Figure 2, when corrected for Φ size, is actually larger at smaller Φ values and decreases with increases in the size of Φ. The smaller coefficient of variation for the larger Φ values likely reflects a “ceiling effect,” with no values >180° possible.

