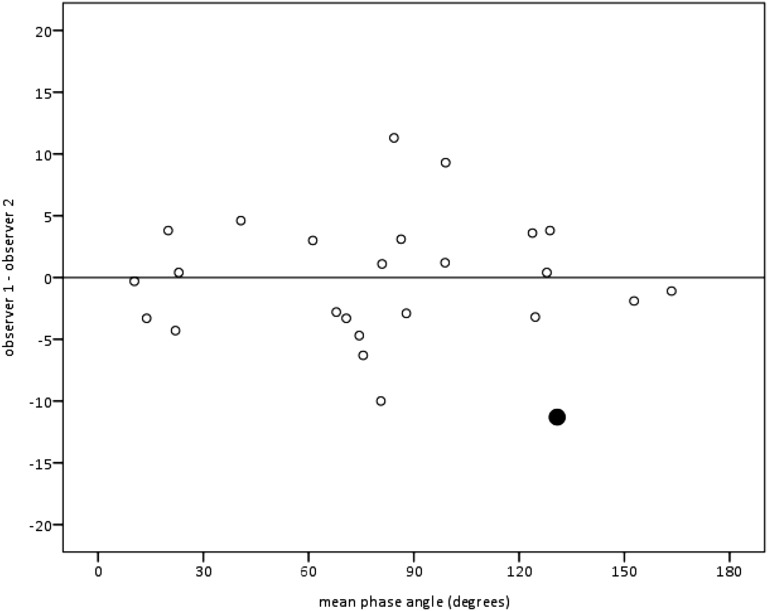
Figure 4.
Interobserver differences for 25 infants illustrated by a Bland-Altman plot showing the differences in mean Φ obtained by two independent observers (L.N.U., J.S.K.) versus the average of their two means (mean observer 1 + mean observer 2, divided by 2). The result indicated by the large filled circle is for the 1 of 25 subjects compared when Φ results differed statistically between the two observers.

