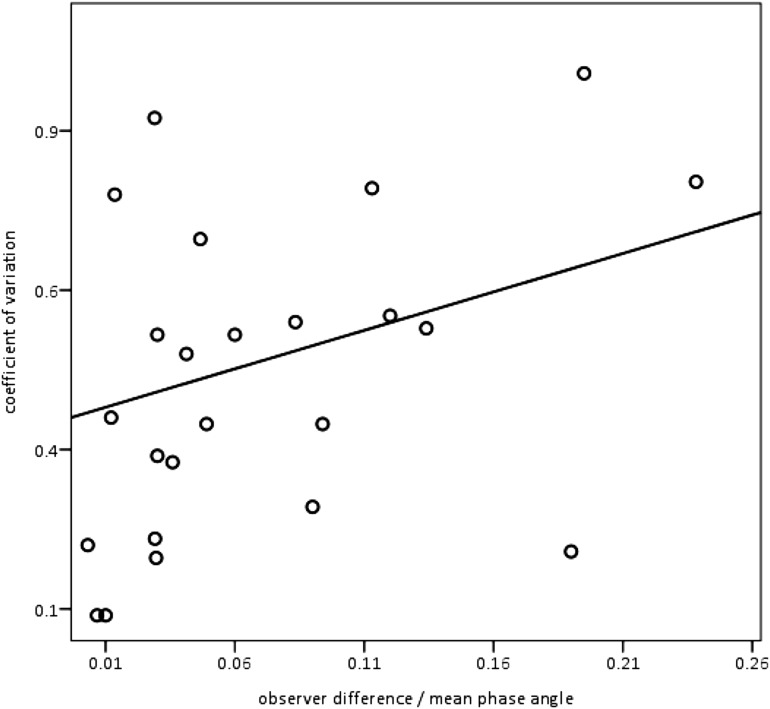
Figure 5.
Differences between observers in breath selection had a minimal impact on variability. For the 25 recordings scored by 2 observers, individual subjects’ coefficients of variation are plotted on the y-axis against interobserver differences divided by mean Φ r2 = 0.081. For clarity, dividing by the mean Φ was a necessary size correction because a small mean Φ with, for example, a SD of 10, would have a large coefficient of variation, whereas the same SD would be associated with a much smaller coefficient of variation if the mean Φ were, for example, >> 100°.

