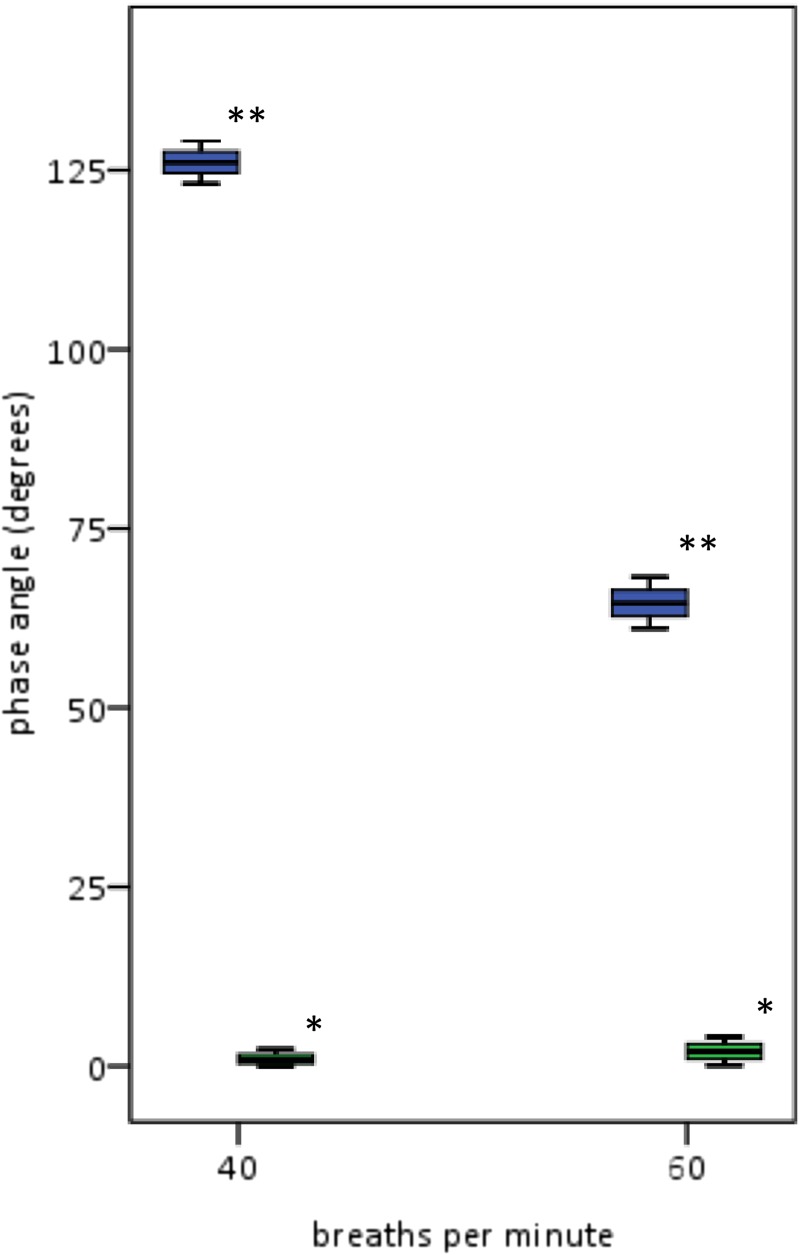
Figure 6.
Φ variability from synchronous and dyssynchronous mechanical models with Vf of approximately 40 and 60 breaths per minute. Shown are the 25th and 75th percentiles and the medians with ranges for Φ from the synchronous model (*) near 0°. For the dyssynchronous model (**), Φ coefficients of variation are 1.1% and 2.3% at Vf of 40 and 60 per minute, respectively. These results show that the recording and analysis equipment contributed minimally to the variability in Φ measurements.

