
Figure 4.5.
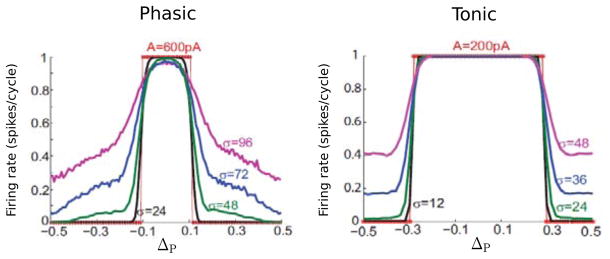
“Interaural” phase tuning curves (firing rate versus IPD, ΔP) for the phasic (left) and tonic (right) V – U model for 100 Hz input. Different curves correspond to different noise levels σ (in pA). The sinusoidal amplitude is 600 and 300 pA for the phasic and tonic model, respectively. (Adapted from [40, fig. 5] with permission from the authors.)