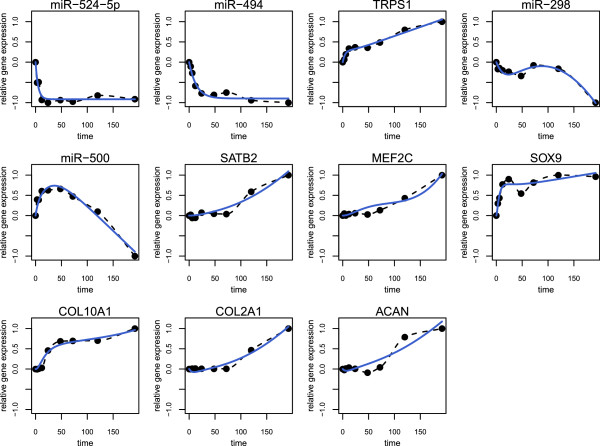
Figure 3.

Chondrogenesis model: time courses. Comparison of the measured and simulated time courses. Each panel displays the results of one model component: the simulated time course (blue solid line), interpolated measurements (black dashed line) and the measured time series (black dots).
