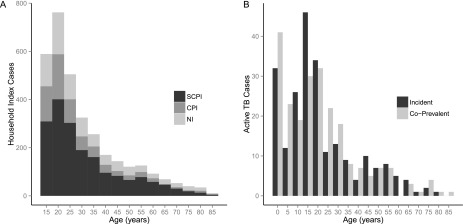
Figure 2.

Age distributions of index cases and secondary tuberculosis (TB) cases in a household. (A) Distribution of ages for the 3,446 index TB cases in our analysis. Shading of the bars in the histogram indicates the proportion of index cases in each age group who were smear- and culture-positive for TB disease (SCPI), smear-negative and culture-positive (CPI), or smear-negative and culture-negative (NI). (B) Distribution of ages for the 454 HIV-negative cases of TB disease identified among 14,041 household contacts of 3,446 index TB cases. Bars are broken down to show the number of cases in each age group that were either coprevalent with the index case or developed TB after the baseline observation. Each bin in both histograms represents a 5-year age group.
