
Figure 2.
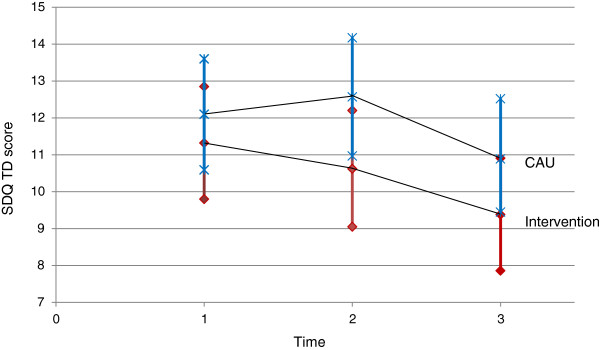
Estimated means and 95% confidence intervals for the Strengths and Difficulties Questionnaire Total Difficulties Score (SDQ-TDS; primary outcome) by treatment group. The analysis was corrected for baseline values. Intervention group is represented by the red line and diamonds for the point estimate and the 95% confidence interval borders. Usual care group is represented by the blue line and crosses for the point estimate and the 95% confidence interval borders.