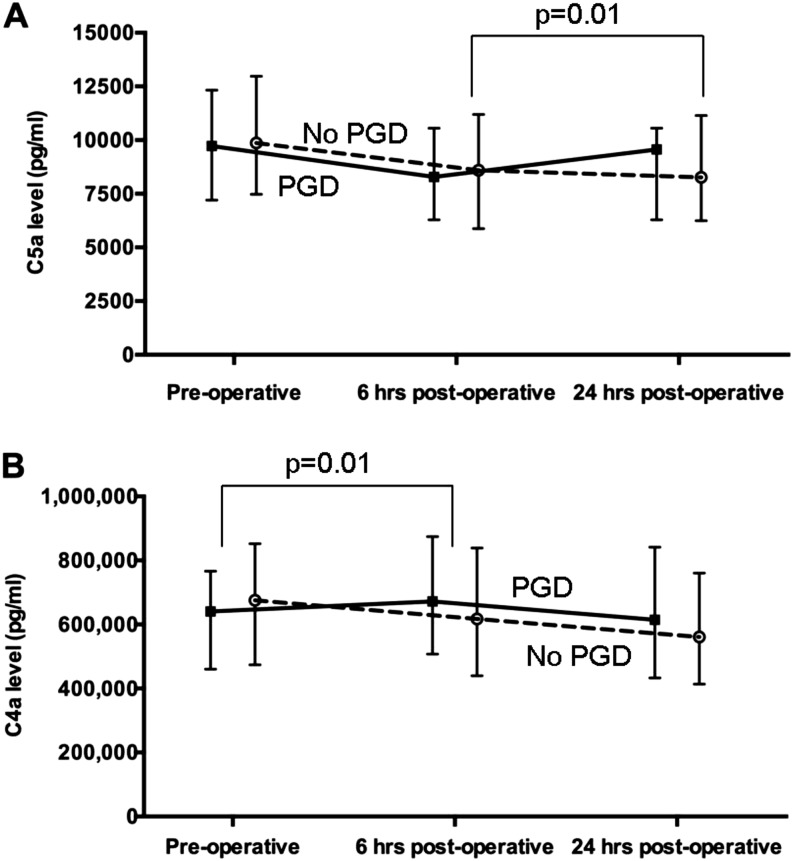
Figure 1.
(A) Plasma C5a concentration at each time point in subjects without primary graft dysfunction (PGD) (dashed line) and with grade 3 PGD (solid line). The P value indicates that the difference in C5a concentration (represented by the slope of the line) between the 6-hour time point and the 24-hour time point is significantly greater in those with PGD compared with those without. (B) Plasma C4a concentration at each time point in subjects without PGD (dashed line) and with grade 3 PGD (solid line). The P value indicates that the difference in C4a concentration between the preoperative time point and the 6-hour time point (represented by the slope of the line) is significantly greater in those with PGD compared with those without.

