
Fig. 3.
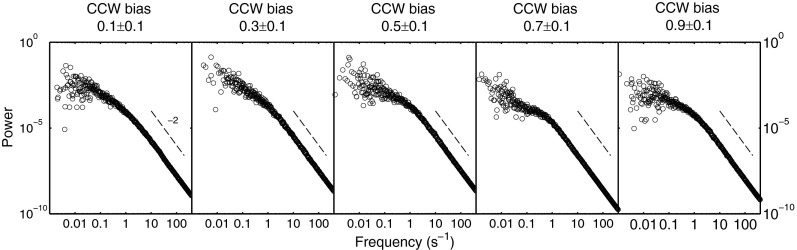
Power spectra for the same 67 motors as in Fig. 1. The power spectra were averaged for motors in each CCW bias group. Dashed lines with slope of −2 expected for the tail of a Lorentzian profile were provided as references.
Official websites use .gov
A
.gov website belongs to an official
government organization in the United States.
Secure .gov websites use HTTPS
A lock (
) or https:// means you've safely
connected to the .gov website. Share sensitive
information only on official, secure websites.
Power spectra for the same 67 motors as in Fig. 1. The power spectra were averaged for motors in each CCW bias group. Dashed lines with slope of −2 expected for the tail of a Lorentzian profile were provided as references.